Page 33 - Turkinsurance Digital Magazine
P. 33

31


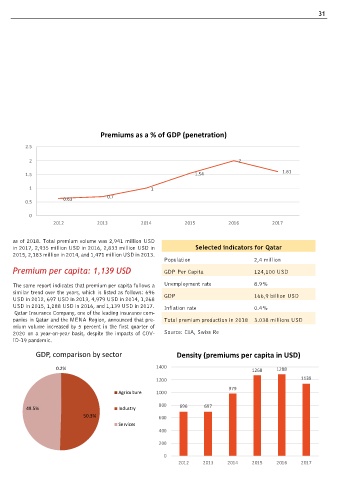
                                    Premiums as a % of GDP (penetration)

          2.5

           2                                                                         2


          1.5                                                        1.54                           1.61
           1                                          1

                       0.63            0.7
          0.5
           0
                    2012           2013            2014           2015           2016            2017


      as of 2018. Total premium volume was 2,941 million USD
      in 2017, 2,935 million USD in 2016, 2,833 million USD in        Selected indicators for Qatar
      2015, 2,183 million in 2014, and 1,471 million USD in 2013.
                                                           Population                     2,4 million
      Premium per capita: 1,139 USD                        GDP Per Capita                 124,100 USD

      The same report indicates that premium per capita follows a   Unemployment rate     8.9%
      similar trend over the years, which is listed as follows: 696   GDP                 166,9 billion USD
      USD in 2012, 697 USD in 2013, 4,979 USD in 2014, 1,268
      USD in 2015, 1,288 USD in 2016, and 1,139 USD in 2017.    Inflation rate            0.4%
       Qatar Insurance Company, one of the leading insurance com-
      panies in Qatar and the MENA Region, announced that pre-  Total premium production in 2018  3.038 millions USD
      mium volume increased by 5 percent in the first quarter of
      2020 on a year-on-year basis, despite the impacts of COV-  Source: CIA, Swiss Re
      ID-19 pandemic.

              GDP, comparison by sector                        Density (premiums per capita in USD)


                     0.2%                               1400                              1268    1288
                                                        1200                                               1139
                                                                                 979
                                           Agriculture  1000

                                                         800    696      697
          49.5%                            Industry
                              50.3%                      600
                                           Services
                                                         400
                                                         200

                                                           0
                                                                2012    2013     2014     2015    2016     2017
   28   29   30   31   32   33   34   35   36   37   38