
Page 36 - TurkinsuranceDigitalMagazine
P. 36
34 country profile
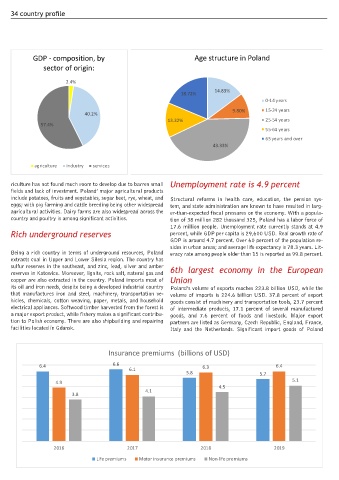
GDP - composition, by Age structure in Poland
sector of origin:
2.4%
14.83%
18.72%
0-14 years
9.80% 15-24 years
40.2%
13.32% 25-54 years
57.4%
55-64 years
65 years and over
43.33%
agriculture industry services
riculture has not found much room to develop due to barren small Unemployment rate is 4.9 percent
fields and lack of investment. Poland’ major agricultural products
include potatoes, fruits and vegetables, sugar beet, rye, wheat, and Structural reforms in health care, education, the pension sys-
eggs; with pig farming and cattle breeding being other widespread tem, and state administration are known to have resulted in larg-
agricultural activities. Dairy farms are also widespread across the er-than-expected fiscal pressures on the economy. With a popula-
country and poultry is among significant activities. tion of 38 million 282 thousand 325, Poland has a labor force of
17.6 million people. Unemployment rate currently stands at 4.9
Rich underground reserves percent, while GDP per capita is 29,600 USD. Real growth rate of
GDP is around 4.7 percent. Over 60 percent of the population re-
sides in urban areas; and average life expectancy is 78.3 years. Lit-
Being a rich country in terms of underground resources, Poland eracy rate among people older than 15 is reported as 99.8 percent.
extracts coal in Upper and Lower Silesia region. The country has
sulfur reserves in the southeast, and zinc, lead, silver and amber
reserves in Katowice. Moreover, lignite, rock salt, natural gas and 6th largest economy in the European
copper are also extracted in the country. Poland imports most of Union
its oil and iron needs, despite being a developed industrial country Poland’s volume of exports reaches 223.8 billion USD, while the
that manufactures iron and steel, machinery, transportation ve- volume of imports is 224.6 billion USD. 37.8 percent of export
hicles, chemicals, cotton weaving, paper, metals, and household goods consist of machinery and transportation tools, 23.7 percent
electrical appliances. Softwood timber harvested from the forest is of intermediate products, 17.1 percent of several manufactured
a major export product, while fishery makes a significant contribu- goods, and 7.6 percent of foods and livestock. Major export
tion to Polish economy. There are also shipbuilding and repairing partners are listed as Germany, Czech Republic, England, France,
facilities located in Gdansk. Italy and the Netherlands. Significant import goods of Poland
Insurance premiums (billions of USD)
6.4 6.6 6.3 6.4
6.1
5.8 5.7
4.9 5.1
4.5
4.1
3.8
2016 2017 2018 2019
Life premiums Motor insurance premiums Non-life premiums