
Page 17 - Turkinsurance Digital Magazine
P. 17
15
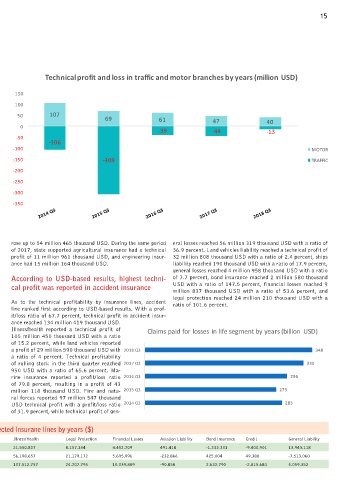
Technical profit and loss in traffic and motor branches by years (million USD)
150
100
50 107
69 61 47 40
0
-39 -44 -13
-50
-106
-100 MOTOR
-150 -309 TRAFFIC
-200
-250
-300
-350
rose up to 54 million 465 thousand USD. During the same period eral losses reached 56 million 319 thousand USD with a ratio of
of 2017, state supported agricultural insurance had a technical 36.9 percent. Land vehicles liability reached a technical profit of
profit of 11 million 961 thousand USD, and engineering insur- 32 million 808 thousand USD with a ratio of 2.4 percent, ships
ance had 15 million 164 thousand USD. liability reached 190 thousand USD with a ratio of 17.9 percent,
general losses reached 4 million 958 thousand USD with a ratio
According to USD-based results, highest techni- of 7.7 percent, bond insurance reached 2 million 580 thousand
cal profit was reported in accident insurance USD with a ratio of 147.5 percent, financial losses reached 9
million 837 thousand USD with a ratio of 53.6 percent, and
legal protection reached 24 million 210 thousand USD with a
As to the technical profitability by insurance lines, accident ratio of 101.6 percent.
line ranked first according to USD-based results. With a prof-
it/loss ratio of 67.7 percent, technical profit in accident insur-
ance reached 134 million 419 thousand USD.
Illness/health reported a technical profit of Claims paid for losses in life segment by years (billion USD)
105 million 450 thousand USD with a ratio
of 15.2 percent, while land vehicles reported
a profit of 29 million 590 thousand USD with 2018 Q3 348
a ratio of 4 percent. Technical profitability
of rolling stock in the third quarter reached 2017 Q3 330
950 USD with a ratio of 65.6 percent. Ma-
rine insurance reported a profit/loss ratio 2016 Q3 296
of 79.8 percent, resulting in a profit of 43
million 118 thousand USD. Fire and natu- 2015 Q3 273
ral forces reported 97 million 547 thousand
USD technical profit with a profit/loss ratio 2014 Q3 285
of 31.9 percent, while technical profit of gen-
Technical profit and loss in selected insurane lines by years ($)
Accident Land Vehicles General Losses Land Vehicles Liability Marine Fire and Natural Forces Illness/Health Legal Protection Financial Losses Aviation Liability Bond Insurance Credit General Liability
2016 Q3 64.843.935 61.188.072 34.804.217 -11.959.850 22.730.470 1.775.621 21.550.827 8.157.354 4.452.709 491.418 -1.233.331 -9.400.901 13.943.118
2017 Q3 99.355.860 47.108.536 44.286.480 -22.838.645 26.862.866 40.056.824 56.198.657 21.179.172 5.695.996 -232.866 425.004 49.388 -7.513.060
2018 Q3 137.048.302 40.365.080 57.459.828 33.472.656 43.991.448 99.522.004 107.512.757 24.707.795 10.039.889 -90.858 2.632.790 -2.815.684 5.059.352