
Page 9 - Turkinsurance Digital Magazine
P. 9
7
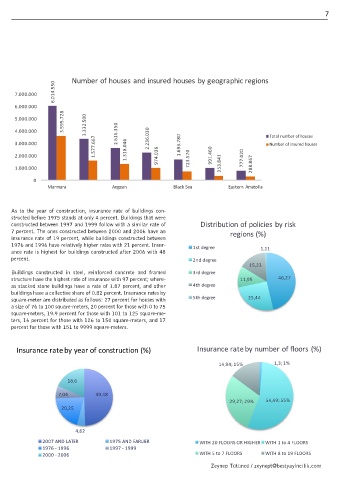
Number of houses and insured houses by geographic regions
6.014.550
7.000.000
6.000.000
3.595.728 3.332.500
5.000.000
4.000.000 2.616.350 Total number of houses
3.000.000 1.577.667 2.236.030 1.693.780 Number of insured houses
2.000.000 1.318.046 974.036 723.570 991.460 777.020
1.000.000 353.841 288.867
0
Marmara Aegean Black Sea Eastern Anatolia
As to the year of construction, insurance rate of buildings con-
structed before 1975 stands at only 4 percent. Buildings that were
constructed between 1997 and 1999 follow with a similar rate of Distribution of policies by risk
7 percent. The ones constructed between 2000 and 2006 have an regions (%)
insurance rate of 19 percent, while buildings constructed between
1976 and 1996 have relatively higher rates with 21 percent. Insur- 1st degree 1,11
ance rate is highest for buildings constructed after 2006 with 48
percent. 2nd degree
15,23
Buildings constructed in steel, reinforced concrete and framed 3rd degree
structure have the highest rate of insurance with 97 percent; where- 11,95 46,27
as stacked stone buildings have a rate of 1.87 percent, and other 4th degree
buildings have a collective share of 0.82 percent. Insurance rates by
square-meter are distributed as follows: 27 percent for houses with 5th degree 25,44
a size of 76 to 100 square-meters, 20 percent for those with 0 to 75
square-meters, 19.9 percent for those with 101 to 125 square-me-
ters, 16 percent for those with 126 to 150 square-meters, and 17
percent for those with 151 to 9999 square-meters.
Insurance rate by year of construction (%) Insurance rate by number of floors (%)
14,94; 15% 1,3; 1%
18,6
7,04 49,48
29,27; 29% 54,49; 55%
20,25
4,62
2007 AND LATER 1975 AND EARLIER WITH 20 FLOORS OR HIGHER WITH 1 to 4 FLOORS
1976 - 1996 1997 - 1999
2000 - 2006 WITH 5 to 7 FLOORS WITH 8 to 19 FLOORS
Zeynep Tütüncü / zeynept@bestyayincilik.com