
Page 19 - Turkinsurance Digital Magazine
P. 19
16 17
Rate of technical profit in life insurance by years
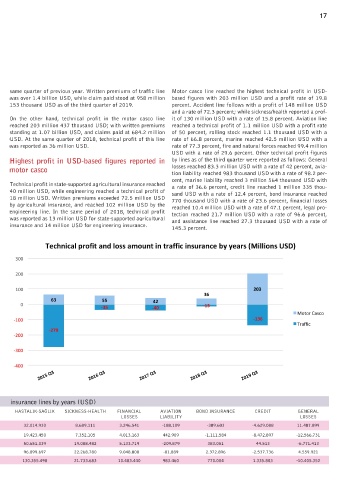
same quarter of previous year. Written premiums of traffic line Motor casco line reached the highest technical profit in USD-
was over 1.4 billion USD, while claim paid stood at 958 million based figures with 203 million USD and a profit rate of 19.8
300000000.0 Yıllar itibarıyla hayat branşında teknik kar ve kar/zarar oranları 25% 153 thousand USD as of the third quarter of 2019. percent. Accident line follows with a profit of 148 million USD
Rate of technical profit in life insurance by years and a rate of 72.3 percent; while sickness/health reported a prof-
23%
22% On the other hand, technical profit in the motor casco line it of 130 million USD with a rate of 15.8 percent. Aviation line
250000000.0 20% reached 203 million 437 thousand USD; with written premiums reached a technical profit of 1.1 million USD with a profit rate
25%
300000000.0 20% 20% standing at 1.07 billion USD, and claims paid at 684.2 million of 50 percent, rolling stock reached 1.1 thousand USD with a
25.0%
1,800,000,000 18% 23% USD. At the same quarter of 2018, technical profit of this line rate of 66.8 percent, marine reached 42.5 million USD with a
200000000.0
1,600,000,000 21.8% 22% 22.7% was reported as 36 million USD. rate of 77.3 percent, fire and natural forces reached 99.4 million
250000000.0
20%
1,400,000,000 19.6% 20% 20.2% 20% 20.0% 15% USD with a rate of 29.6 percent. Other technical profit figures
1,200,000,000 18.0% Highest profit in USD-based figures reported in by lines as of the third quarter were reported as follows: General
18%
150000000.0
200000000.0
1,000,000,000 15.0% 10% motor casco losses reached 83.3 million USD with a rate of 42 percent, avia-
800,000,000 10.0% 15% tion liability reached 983 thousand USD with a rate of 98.2 per-
100000000.0
600,000,000 Technical profit in state-supported agricultural insurance reached cent, marine liability reached 3 million 564 thousand USD with
150000000.0
400,000,000 478,058,777 80346012.941 611,391,155 102754815.966 952,042,001 160007058.992 1,118,253,298 187941730.756 1,554,046,007 5.0% 05% 40 million USD, while engineering reached a technical profit of a rate of 36.6 percent, credit line reached 1 million 335 thou-
10%
50000000.0
200,000,000 261,184,203 18 million USD. Written premiums exceeded 72.5 million USD sand USD with a rate of 12.4 percent, bond insurance reached
100000000.0
770 thousand USD with a rate of 23.6 percent, financial losses
80346012.941
0 0.0% by agricultural insurance, and reached 102 million USD by the reached 10.4 million USD with a rate of 47.1 percent, legal pro-
261,184,203
.0 2015 Q3 2016 Q3 102754815.966 2017 Q3 160007058.992 2018 Q3 187941730.756 2018 Q3 00% engineering line. In the same period of 2018, technical profit
05%
50000000.0 2015 Q3 2016 Q3 2017 Q3 2018 Q3 2018 Q3 was reported as 13 million USD for state-supported agricultural tection reached 21.7 million USD with a rate of 96.6 percent,
and assistance line reached 27.3 thousand USD with a rate of
Hayat branşı teknik kar (TL) Teknik Kar/Zarar oranı (%) insurance and 14 million USD for engineering insurance. 145.3 percent.
Life insurance technical profit (USD)
Profit Rate (%)
.0 00%
2015 Q3 2016 Q3 2017 Q3 2018 Q3 2018 Q3
Technical profit and loss amount in traffic insurance by years (Millions USD)
Life insurance technical profit (USD) Profit Rate (%)
300
quarter reached 2 billion 999 million USD, compared to 2 bil- Claims paid grew by 18.7 percent compared to
lion 530 million USD paid last year. Written premiums which the third quarter of 2018
had a great influence on the third quarter of 2019 reached 4 200
billion 574 million USD in the non-life segment and 1 billion
195 million USD in the life segment. The results indicate that claims paid grew by 18.7 percent com- 100 203
pared to the same period of last year. In the third quarter of 36
55
Highest amount of claims payment was in land vehicles liability 2018, non-life technical profit was 500 million 672 thousand 0 63 -35 42 -13
with 993 million USD, followed respectively by land vehicles USD and life technical profit was 187 million 899 thousand -40 Motor Casco
with 684.2 million USD, sickness/health with 607.7 million USD. As to the amount of claims paid, the market had paid 2 -100 -136
USD, fire and natural forces with 171.4 million USD, general billion 215 million USD in the non-life segment and 314 million Traffic
losses with 90 million USD, engineering insurance with 58.9 453 thousand USD in the life segment as of the third quarter of -279
million USD, state-supported agricultural insurance with 19.4 2018. -200
million USD, general liability with 19.1 million USD, accident
with 17.1 million USD, ships hull and machinery with 16.6 mil- Technical loss in traffic is 136 million 287 thou- -300
lion USD, marine with 13.6 million USD, financial losses with sand USD
10.4 million USD, credit with 4 million USD, bond insurance -400
with 1.4 million USD, aviation liability with 1.1 million USD, Amount of technical loss grew in traffic insurance as of the end 2015 Q3 2016 Q3 2017 Q3 2018 Q3 2019 Q3
legal protection with 116 thousand USD, and marine liability of 2019 third quarter, reaching 136 million 287 thousand USD.
with 60.3 thousand USD. This is a serious growth compared to the 13 million USD in the
Technical loss and profit in selected insurance lines by years (USD)
ACCIDENT LAND VEHICLES GENERAL LOSSES LAND VEHICLES MARINE GOODS FIRE AND NATURAL HASTALIK-SAĞLIK SICKNESS-HEALTH FINANCIAL AVIATION BOND INSURANCE CREDIT GENERAL
LIABILITY ON TRANSIT FORCES LOSSES LIABILITY LOSSES
2015 Q3 51.863.065 62.797.244 24.641.058 -240.676.092 17.783.778 24.031.296 32.014.930 8.689.111 3.246.541 -188.109 -389.603 -4.629.088 11.487.899
2016 Q3 58.442.904 55.147.927 31.368.539 -10.779.241 20.486.644 1.600.342 19.423.450 7.352.105 4.013.163 442.909 -1.111.584 -8.472.897 -12.566.731
2017 Q3 89.548.003 42.458.244 39.914.766 -20.584.141 24.211.114 36.102.638 50.651.039 19.088.482 5.133.719 -209.879 383.051 44.513 -6.771.413
2018 Q3 123.519.657 36.380.465 51.787.714 30.168.422 39.648.858 89.697.746 96.899.697 22.268.780 9.048.808 -81.889 2.372.896 -2.537.736 4.559.921
2019 Q3 148.933.014 203.437.602 83.372.671 -115.936.734 42.530.832 99.498.242 130.355.498 21.733.683 10.483.440 983.460 770.004 1.335.803 -10.405.352