Page 32 - Turkinsurance Digital Magazine
P. 32

30 country profile                                                                                                                                                                                                                 31


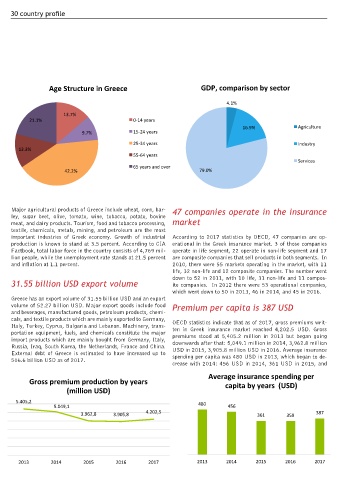
                  Age Structure in Greece                               GDP, comparison by sector                                                              Ratio of gross premiums to GDP (%)


                                                                                 4.1%
                       13.7%
           21.1%                                0-14 years
                                                                                      16.9%               Agriculture
                              9.7%              15-24 years

                                                25-34 years                                               Industry              2.20%
        13.3%
                                                55-64 years                                                                                             2.10%
                                                                                                          Services                                                                                                                 2.05%
                                                65 years and over                                                                                                                1.99%                    1.98%
                        42.2%                                          79.0%

                                                                                                                                2013                     2014                     2015                     2016                     2017


                                                                                                                            359 USD in 2016. In 2017 it began increasing again with 387
     Major agricultural products of Greece include wheat, corn, bar-  47 companies operate in the insurance                                                                                Life insurance payments, by class,
     ley,  sugar  beet,  olive,  tomato,  wine,  tobacco,  potato,  bovine                                                  USD. Ratio of gross premiums compared to the GDP progressed
     meat, and dairy products. Tourism, food and tobacco processing,  market                                                in  parallel  with  the  abovementioned  figures:  2.20%  in  2013,   gross premiums (Millions USD)
     textile, chemicals, metals, mining, and petroleum are the most                                                         2.10% in 2014, 1.99% in 2015, 1.98% in 2016, and 2.05%
     important industries of Greek economy. Growth of industrial  According to 2017 statistics by OECD, 47 companies are op-  in 2017.
     production is known to stand at 3.5 percent. According to CIA  erational in the Greek insurance market. 3 of those companies
     Factbook, total labor force in the country consists of 4,769 mil-  operate in life segment, 22 operate in non-life segment and 17   Of the 2,109 million life insurance premiums in 2017, 389 mil-           389
     lion people, while the unemployment rate stands at 21.5 percent  are composite companies that sell products in both segments.  In   lion USD were written in unit linked life insurance, and 1,720
     and inflation at 1.1 percent.                            2010, there were 55 markets operating in the market, with 11   million USD were written in other life insurance. On the other
                                                              life, 32 non-life and 12 composite companies. The number went   hand, total non-life insurance premiums stood at 2,071 million
                                                              down to 52 in 2011, with 10 life, 31 non-life and 11 compos-  USD; 1,052 million USD of which were written in motor vehicle
     31.55 billion USD export volume                          ite companies.  In 2012 there were 53 operational companies,   insurance, 446 million USD in fire and other property damage,
                                                              which went down to 50 in 2013, 46 in 2014, and 45 in 2016.    and 271 million USD in accident and health insurance. Produc-              1.720
     Greece has an export volume of 31.55 billion USD and an export                                                         tion of other insurance lines were reported as follows: 38 million
     volume of 52.27 billion USD. Major export goods include food   Premium per capita is 387 USD                           USD in marine, aviation and other transport insurance, 31 mil-
     and beverages, manufactured goods, petroleum products, chemi-                                                          lion USD in pecuniary loss insurance, 70 million USD in general
     cals, and textile products which are mainly exported to Germany,   OECD statistics indicate that as of 2017, gross premiums writ-  liability insurance, and 163 million USD in other non-life insur-
     Italy, Turkey, Cyprus, Bulgaria and Lebanon. Machinery, trans-  ten in Greek insurance market reached 4,202.5 USD. Gross   ance.                                                              Unit linked   Other life insurance
     portation equipment, fuels, and chemicals constitute the major   premiums stood at 5,405.2 million in 2013 but began going
     import products which are mainly bought from Germany, Italy,   downwards after that: 5,049.1 million in 2014, 3,962.8 million
     Russia, Iraq, South Korea, the Netherlands, France and China.   USD in 2015, 3,905.8 million USD in 2016. Average insurance
     External  debt  of  Greece  is  estimated  to  have  increased  up  to   spending per capita was 480 USD in 2013, which began to de-    Non-life insurance payments, by class, gross premiums (Millions USD)
     506.6 billion USD as of 2017.
                                                              crease with 2014: 456 USD in 2014, 361 USD in 2015, and
                                                                          Average insurance spending per                                                      163
           Gross premium production by years                                    capita by years  (USD)                                                                                         Motor vehicle insurance
                        (million USD)                                                                                                                 271                                      Marine, aviation and other transport insurance

       5.405,2                                                         480
                    5.049,1                                                      456                                                                                                           Fire and other property damage insurance
                             3.962,8     3.905,8    4.202,5                                361        359       387                                70
                                                                                                                                               31                                              Pecuniary loss insurance
                                                                                                                                                                               1,052
                                                                                                                                                                                               General liability insurance
                                                                                                                                                                                               Accident and health
                                                                                                                                                       446
                                                                                                                                                                                               Other non-life insurance

        2013       2014       2015        2016       2017             2013      2014       2015      2016       2017                                38
   27   28   29   30   31   32   33   34   35   36   37