
Page 30 - Turkinsurance Digital Magazine
P. 30
30 country profile
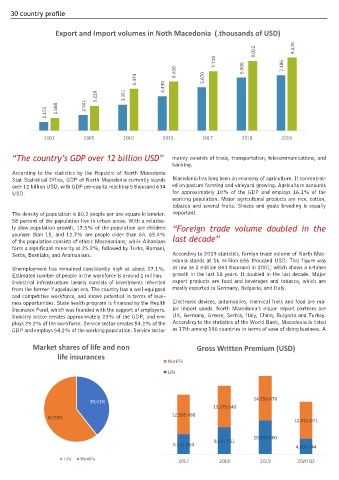
Export and Import volumes in Noth Macedonia (.thousands of USD)
9.052 9.470
7.719 7.186
6.400 6.906
5.474 4.490 5.670
3.228 3.351
1.155 1.688 2.041
2001 2005 2010 2015 2017 2018 2019
“The country’s GDP over 12 billion USD” mainly consists of trade, transportation, telecommunications, and
banking.
According to the statistics by the Republic of North Macedonia
Stat Statistical Office, GDP of North Macedonia currently stands Macedonia has long been an economy of agriculture. It concentrat-
over 12 billion USD, with GDP per-capita reaching 5 thousand 634 ed on pasture farming and vineyard growing. Agriculture accounts
USD. for approximately 10% of the GDP and employs 16.1% of the
working population. Major agricultural products are rice, cotton,
tobacco and several fruits. Sheeps and goats breeding is equally
The density of population is 80.2 people per one square kilometer. important.
58 percent of the population live in urban areas. With a relative-
ly slow population growth, 17.5% of the population are children “Foreign trade volume doubled in the
younger than 15, and 12.7% are people older than 64. 65.4%
of the population consists of ethnic Macedonians; while Albanians last decade”
form a significant minority at 25.2%, followed by Turks, Romani,
Serbs, Bosniaks, and Aromanians. According to 2019 statistics, foreign trade volume of North Mac-
edonia stands at 16 million 656 thousand USD. This figure was
Unemployment has remained consistently high at about 17.1%. as low as 2 million 843 thousand in 2001; which shows a 6-times
Estimated number of people in the workforce is around 1 million. growth in the last 18 years. It doubled in the last decade. Major
Industrial infrastructure largely consists of investments inherited export products are food and beverages and tobacco, which are
from the former Yugoslavian era. The country has a well-equipped mostly exported to Germany, Bulgaria, and Italy.
and competitive workforce, and shows potential in terms of busi-
ness opportunities. State health program is financed by the Health Electronic devices, automobiles, chemical fuels and food are ma-
Insurance Fund, which was founded with the support of employers. jor import goods. North Macedonia’s major import partners are
Industry sector creates approximately 23% of the GDP, and em- UK, Germany, Greece, Serbia, Italy, China, Bulgaria and Turkey.
ploys 29.2% of the workforce. Service sector creates 54.2% of the According to the statistics of the World Bank, Macedonia is listed
GDP and employs 54.2% of the working population. Service sector as 17th among 190 countries in terms of ease of doing business. A
Market shares of life and non Gross Written Premium (USD)
life insurances
Nonlife
Life
14.258.478
39,41%
13.375.640
12.595.488
60,59%
12.012.071
10.892.600
8.647.951
6.511.854 4.904.744
Life Nonlife 2017 2018 2019 2020 Q3