
Page 25 - Turkinsurance Digital Magazine
P. 25
25
At the end of 2020, fund size of participants in voluntary Individual
Pension System grew by 34.5 percent, reaching 137 billion 93 million
TL compared to 101 billion 883 million TL at the end of 2019. During
the first half of 2020, funds with highest returns were listed as pre-
cious metals funds, participation funds, borrowing instruments funds,
composite & flexible funds, fund basket funds, money market funds and
stock funds. At the end of the year, funds with highest ROIs were listed
as: precious metals funds, stock funds, participation funds, fund basket
funds, borrowing instruments funds, composite & flexible funds, and
money market funds.
Highest return in precious metals funds
Pension mutual funds aim to bring highest returns to its investors at the
end of the year. When we analyze their 2020 year-end performance, we
see that precious metals funds brought an ROI of 53.72 percent to its
investors. Last year, return of precious metals funds was reported as
31.93 percent. Monthly occupancy rate of precious metals funds was
5.81 percent in January, 6.14 percent in February, 6.41 percent in
March, 6.58 in April, 6.74 percent in May, 6.97 percent in June, 7.31
percent in July, 7.68 percent in August, 7.91 percent in September,
8 percent in October, 8.14 percent in November, and 8.15 percent in
December.
Stock funds brought a return of 32.80 percent
Stock funds had brought the highest return in 2019 with 37.6 percent,
but retracted one step in 2020 and were listed as the second most prof-
itable fund group with a return of 32.80 percent at the end of 2020.
Monthly occupancy rate of stock funds was 1.18 percent in January and
February, 1.25 percent in March, 1.27 in April, 1.29 percent in May,
1.25 percent in June, 1.21 percent in July and August, 1.23 percent in
September, 1.22 percent in October, 1.24 percent in November, and
1.30 percent in December.
Return of participation funds grew compared to previous year
Third most profitable fund group at the year-end was participation
funds. In 2019, participation funds had brought a return of 27.57 per-
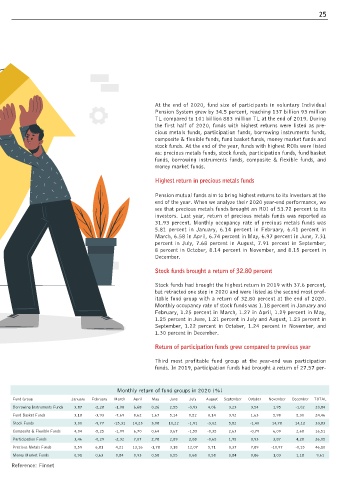
Monthly return of fund groups in 2020 (%)
Fund Group January February March April May June July August September October November December TOTAL
Borrowing Instruments Funds 3,87 -2,28 -1,08 6,68 0,26 2,55 -0,93 4,06 3,23 3,54 1,95 -1,02 20,84
Fund Basket Funds 3,18 -3,93 -7,69 8,62 1,67 5,14 0,52 0,14 3,92 1,63 5,98 5,30 24,46
Stock Funds 3,00 -9,77 -15,31 14,23 3,08 10,22 -1,91 -3,02 5,82 -1,40 14,78 14,12 33,83
Composite & Flexible Funds 4,04 -5,25 -1,99 6,70 0,64 3,67 -1,55 -0,35 2,63 -0,79 6,09 2,68 16,51
Participation Funds 3,46 -0,29 -2,32 7,07 2,78 2,89 2,08 -0,65 1,95 0,93 3,87 4,28 26,05
Precious Metals Funds 5,59 6,81 4,21 13,16 -1,78 3,18 12,07 5,71 0,37 7,89 -10,97 -0,15 46,10
Money Market Funds 0,91 0,63 0,84 0,93 0,58 0,55 0,68 0,58 0,84 0,86 1,03 1,18 9,61
Reference: Finnet