
Page 20 - Turkinsurance Digital Magazine
P. 20
20
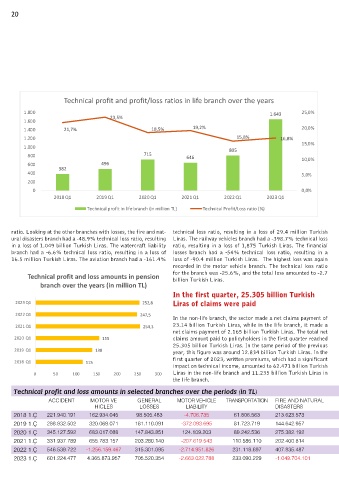
Technical profit and profit/loss ratios in life branch over the years
1.800 1.643 25,0%
23,5%
1.600
1.400 21,7% 18,5% 19,2% 20,0%
1.200 15,8% 16,8%
1.000 805 15,0%
800 715 646 10,0%
600 496
382
400 5,0%
200
0 0,0%
2018 Q1 2019 Q1 2020 Q1 2021 Q1 2022 Q1 2023 Q1
Technical profit in life branch (in million TL) Technical Profit/Loss ratio (%)
ratio. Looking at the other branches with losses, the fire and nat- technical loss ratio, resulting in a loss of 29.4 million Turkish
ural disasters branch had a -48.9% technical loss ratio, resulting Liras. The railway vehicles branch had a -398.7% technical loss
in a loss of 1.049 billion Turkish Liras. The watercraft liability ratio, resulting in a loss of 1,875 Turkish Liras. The financial
branch had a -6.6% technical loss ratio, resulting in a loss of losses branch had a -54% technical loss ratio, resulting in a
16.5 million Turkish Liras. The aviation branch had a -161.4% loss of -90.4 million Turkish Liras. The highest loss was again
recorded in the motor vehicle branch. The technical loss ratio
Technical profit and loss amounts in pension for the branch was -25.6%, and the total loss amounted to -2.7
billion Turkish Liras.
branch over the years (in million TL)
In the first quarter, 25.305 billion Turkish
2023 Q1 252,8 Liras of claims were paid
2022 Q1 247,5
In the non-life branch, the sector made a net claims payment of
2021 Q1 254,3 23.14 billion Turkish Liras, while in the life branch, it made a
net claims payment of 2.165 billion Turkish Liras. The total net
2020 Q1 155 claims amount paid to policyholders in the first quarter reached
25.305 billion Turkish Liras. In the same period of the previous
2019 Q1 138 year, this figure was around 12.834 billion Turkish Liras. In the
first quarter of 2023, written premiums, which had a significant
2018 Q1 115
impact on technical income, amounted to 62.471 billion Turkish
0 50 100 150 200 250 300 Liras in the non-life branch and 11.235 billion Turkish Liras in
the life branch.
Technical profit and loss amounts in selected branches over the periods (in TL)
ACCIDENT MOTOR VE GENERAL MOTOR VEHICLE TRANSPORTATION FIRE AND NATURAL ILLNESS- LEGAL FINANCIAL LOS- AIRCRAFT SURETY CREDIT GENERAL
HICLES LOSSES LIABILITY DISASTERS HEALTH PROTECTION SES LIABILITY LIABILITY
2018 1.Ç 221.940.191 162.934.045 98.505.483 -4.706.735 61.806.563 213.623.573 73.725.994 47.144.549 17.441.718 996.000 8.677.316 1.307.552 32.223.883
2019 1.Ç 288.832.502 320.068.071 181.110.091 -372.093.695 81.723.719 144.642.957 163.175.134 46.569.413 20.339.636 2.667.699 318.988 -13.805.857 36.460.640
2020 1.Ç 345.127.592 683.017.088 147.843.851 124.109.203 89.242.536 275.382.192 255.660.907 37.453.619 13.938.378 499.676 8.279.406 5.633.391 -39.927.558
2021 1.Ç 331.937.789 655.783.157 203.280.140 -207.619.543 110.586.110 202.400.814 682.019.970 55.679.170 7.519.872 919.715 11.825.762 -599.743 -83.880.006
2022 1.Ç 546.539.722 -1.256.159.467 315.301.095 -2.714.951.826 231.118.697 407.835.487 148.868.332 116.628.280 241.062.768 57.890.559 -42.781.357 51.564.380 201.092.672
2023 1.Ç 601.224.477 4.365.873.957 705.520.354 -2.663.022.788 233.090.229 -1.049.704.101 746.113.053 117.130.841 -90.447.079 3.629.126 55.962.955 103.833.781 99.357.069