
Page 29 - Turkinsurance Digital Magazine
P. 29
27
At the end of 2018, fund size of BES grew by 13.1 percent
over the same period of 2017; increasing from 12.8 billion USD
up to 14.4 billion USD. During the first half of the year, most
profitable funds in terms of return ratios were listed as follows,
respectively: precious metals, money market funds, composite &
flexible funds, borrowing instruments, participation funds, fund
basket funds, and stock funds. At the end of the year, the ranking
was changed into precious metals, money market funds, borrow-
ing instruments, participation funds, composite & flexible funds;
while fund basket funds and stock funds caused losses for their
investors.
Precious metals were the most profitable funds with the
highest occupancy rate
When we analyze the first-half performance of pension funds as
tools aiming to bring long-term returns for their investors, we
see that precious metals funds provided a total return of 35.93
percent for their investors. As to their occupancy rates through-
out the year, precious metals funds were in circulation up to 4.01
percent in January, 4.16 percent in February, 4.31 percent in
March, 4.49 percent in April, 4.85 percent in May, 5.09 per-
cent in June, 5.29 percent in July, 5.51 percent in August, 5.91
percent in September, 6.16 percent in October, 6.34 percent in
November and 5.60 percent in December. Precious metals funds
were the most profitable fund group of 2018 with the highest
occupancy rate of 5.14 percent.
Money market funds had the second highest occupancy rate
of 2018 with an average annual rate of 4.12 percent
Money market funds were the second most profitable fund group
during 2018 with a return of 18.16 percent. Monthly occupancy
rates of this fund group were listed as follows: 3.85 percent in
January, 3.87 percent in February, 4.10 percent in March, 4.08
percent in April, 4.09 percent in May, 4.10 percent in June,
4.14 percent in July, 4.22 percent in August, 4.21 percent in
September, 4.22 percent in October, 4.27 percent in November,
and 4.33 percent in December. Money market funds had the sec-
ond highest occupancy rate of 2018 with an average annual rate
of 4.12 percent.
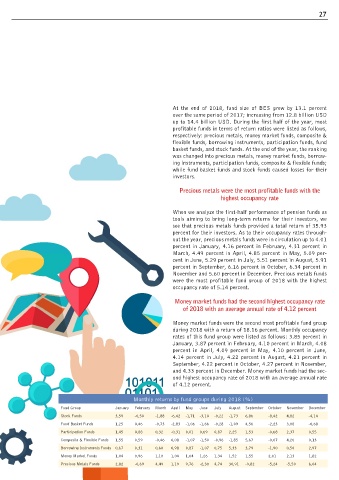
Monthly returns by fund groups during 2018 (%)
Fund Group January February March April May June July August September October November December
Stock Funds 3,59 -0,50 -1,88 -6,42 -1,71 -3,10 -0,22 -1,73 6,86 -8,42 4,82 -4,14
Fund Basket Funds 1,25 0,46 -0,73 -2,83 -1,06 -1,66 -0,28 -1,09 4,56 -2,23 3,08 -0,68
Participation Funds 1,45 0,88 0,32 -0,31 0,01 0,69 0,87 2,25 1,53 -0,68 2,37 0,55
Composite & Flexible Funds 1,55 0,59 -0,46 0,08 -1,07 -1,50 -0,96 -1,85 5,67 -0,07 4,26 0,13
Borrowing Instruments Funds 0,67 0,31 0,60 0,98 0,87 -1,07 0,75 5,33 3,79 -1,90 0,50 2,97
Money Market Funds 1,04 0,96 1,10 1,04 1,04 1,26 1,34 1,52 1,55 2,01 2,13 1,82
Precious Metals Funds 2,82 -0,69 4,49 1,19 9,76 -2,30 4,74 30,91 -9,82 -5,24 -5,50 6,04