
Page 30 - Turkinsurance Digital Magazine
P. 30
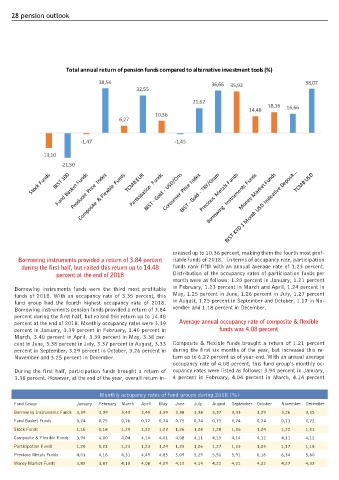
28 pension outlook


                        Total annual return of pension funds compared to alternative investment tools (%)

                                    38,54                                  36,66  35,93                     38,07
                                                 32,55
                                                                     21,62                     18,16
                                                                                        14,48         16,66
                                                       10,36
                                           6,27


                             -1,47                            -1,45

                -13,10
                      -21,50


                                                              creased up to 10.36 percent, making them the fourth most prof-
       Borrowing instruments provided a return of 3.84 percent   itable funds of 2018.   In terms of occupancy rate, participation
         during the first half, but raised this return up to 14.48   funds rank fifth with an annual average rate of 1.23 percent.
                     percent at the end of 2018               Distribution of the occupancy rates of participation funds per
                                                              month were as follows: 1.20 percent in January, 1.21 percent
      Borrowing  instruments  funds  were  the  third  most  profitable   in February, 1.23 percent in March and April, 1.24 percent in
      funds of 2018. With an occupancy rate of 3.35 percent, this   May, 1.25 percent in June, 1.26 percent in July, 1.27 percent
      fund  group  had  the  fourth  highest  occupancy  rate  of  2018.   in August, 1.25 percent in September and October, 1.17 in No-
      Borrowing instruments pension funds provided a return of 3.84   vember and 1.18 percent in December.
      percent during the first half, but raised this return up to 14.48
      percent at the end of 2018. Monthly occupancy rates were 3.39   Average annual occupancy rate of composite & flexible
      percent in January, 3.39 percent in February, 3.40 percent in           funds was 4.08 percent
      March, 3.40 percent in April, 3.39 percent in May, 3.38 per-
      cent in June, 3.38 percent in July, 3.37 percent in August, 3.33  Composite & flexible funds brought a return of 1.21 percent
      percent in September, 3.29 percent in October, 3.26 percent in  during the first six months of the year, but increased this re-
      November and 3.25 percent in December.                  turn up to 6.27 percent as of year-end. With an annual average
                                                              occupancy rate of 4.08 percent, this fund group’s monthly oc-
      During the first half, participation funds brought a return of  cupancy rates were listed as follows: 3.94 percent in January,
      3.38 percent. However, at the end of the year, overall return in-  4  percent  in  February,  4.04  percent  in  March,  4.14  percent


                                    Monthly occupancy rates of fund groups during 2018 (%)
      Fund Group            January  February  March  April  May  June  July  August  September  October  November  December
      Borrowing Instruments Funds  3,39  3,39  3,40  3,40  3,39  3,38  3,38  3,37  3,33    3,29     3,26    3,25
      Fund Basket Funds     0,74    0,75    0,76   0,77  0,74  0,75  0,74   0,75  0,74     0,74     0,73    0,72
      Stock Funds           1,16    1,18    1,20   1,22  1,23  1,26  1,28   1,28  1,26     1,24     1,22    1,21
      Composite & Flexible Funds  3,94  4,00  4,04  4,14  4,01  4,08  4,11  4,15  4,14     4,12     4,11    4,12
      Participation Funds   1,20    1,21    1,23   1,23  1,24  1,25  1,26   1,27  1,25     1,25     1,17    1,18
      Precious Metals Funds  4,01   4,16    4,31   4,49  4,85  5,09  5,29   5,51  5,91     6,16     6,34    5,60
      Money Market Funds    3,85    3,87    4,10   4,08  4,09  4,10  4,14   4,22  4,21     4,22     4,27    4,33