
Page 20 - Turkinsurance Digital Magazine
P. 20
18
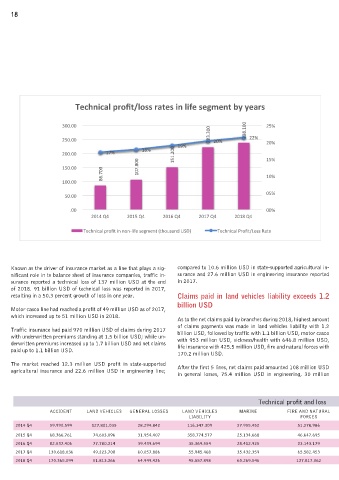
Technical profit/loss rates in life segment by years
300.00 238.100 25%
250.00 223.300 20% 22% 20%
18% 19%
200.00 17% 151.200 15%
86.700 10%
150.00 107.800
100.00
05%
50.00
.00 00%
2014 Q4 2015 Q4 2016 Q4 2017 Q4 2018 Q4
Technical profit in non-‐life segment (thousand USD) Technical Profit/Loss Rate
Known as the driver of insurance market as a line that plays a sig- compared to 10.6 million USD in state-supported agricultural in-
nificant role in te balance sheet of insurance companies, traffic in- surance and 27.6 million USD in engineering insurance reported
surance reported a technical loss of 137 million USD at the end in 2017.
of 2018. 91 billion USD of technical loss was reported in 2017,
resulting in a 50.3 percent growth of loss in one year. Claims paid in land vehicles liability exceeds 1.2
billion USD
Motor casco line had reached a profit of 49 million USD as of 2017,
which increased up to 51 million USD in 2018.
As to the net claims paid by branches during 2018, highest amount
of claims payments was made in land vehicles liability with 1.2
Traffic insurance had paid 970 million USD of claims during 2017 billion USD, followed by traffic with 1.1 billion USD, motor casco
with underwritten premiums standing at 1.5 billion USD; while un- with 953 million USD, sickness/health with 646.8 million USD,
derwritten premiums increased up to 1.7 billion USD and net claims life insurance with 425.5 million USD, fire and natural forces with
paid up to 1.1 billion USD.
170.2 million USD.
The market reached 12.3 million USD profit in state-supported After the first 5 lines, net claims paid amounted 108 million USD
agricultural insurance and 22.6 million USD in engineering line;
in general losses, 75.4 million USD in engineering, 30 million
Technical profit and loss in selected lines by quarters (USD)
ACCIDENT LAND VEHICLES GENERAL LOSSES LAND VEHICLES MARINE FIRE AND NATURAL SICKNESS/HEALTH LEGAL PROTECTION FINANCIAL AVIATION BOND INSURANCE CREDIT GENERAL LOSS-
LIABILITY FORCES LOSSES LIABILITY ES
2014 Q4 59.990.599 127.801.035 28.294.842 116.347.309 27.955.452 51.278.986 20.376.858 8.514.335 4.279.509 72.638 10.881 (1.621.743 27.413.086
2015 Q4 68.366.761 74.603.096 31.954.407 358.774.577 25.134.668 46.647.695 30.753.880 11.287.716 5.019.615 501.083 (4.905 (8.367.790 5.076.123
2016 Q4 82.537.406 77.780.214 39.439.694 35.369.554 28.412.925 23.143.179 21.850.429 11.235.341 6.259.622 423.508 (125.909 (5.154.338 14.648.089
2017 Q4 130.618.036 49.223.708 60.057.886 55.945.468 35.432.359 65.582.453 75.162.384 28.442.471 9.439.560 396.569 1.489.700 587.727 14.743.583
2018 Q4 170.365.099 51.813.266 64.949.426 95.557.898 60.269.546 127.817.062 143.368.982 30.455.715 1.439.615 556.946 3.041.337 (3.247.920 4.083.051