
Page 21 - Turkinsurance Digital Magazine
P. 21
19
USD in general liability, 27 million USD in accident, 21 million Other profitable lines of the non-life segment were lined up as
USD in marine, 15 million USD in state supported agricultural in- general losses with a technical profit of 65 million USD, marine
surance, 11 million USD in ships insurance, 4.7 million USD in with 60.3 million USD, motor casco with 51.8 million USD, le-
credit insurance, 4 million USD in financial losses, 1.7 million USD gal protection with 30.4 million USD, engineering with 22.6 mil-
in aviation, and 1.2 million USD in bond insurance. Much lesser lion USD, and state supported agricultural insurance with 12.3
amount of claims were paid in other lines; namely, 149.6 thousand million USD. General losses followed with 4 million USD, bond
USD in legal protection, 75.2 thousand USD in aviation liability, insurance with 3 million USD, financial losses with 1.4 million
20.3 thousand USD in assistance, 13.2 thousand USD in ships lia- USD, ships liability with 868.1 thousand USD, and aviation lia-
bility, and 2.21 thousand USD in rolling stock. bility with 544.6 thousand USD.
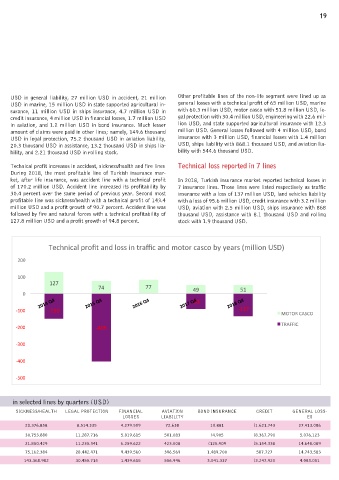
Technical profit increases in accident, sickness/health and fire lines Technical loss reported in 7 lines
During 2018, the most profitable line of Turkish insurance mar-
ket, after life insurance, was accident line with a technical profit In 2018, Turkish insurance market reported technical losses in
of 170.2 million USD. Accident line increased its profitability by 7 insurance lines. Those lines were listed respectively as traffic
30.4 percent over the same period of previous year. Second most insurance with a loss of 137 million USD, land vehicles liability
profitable line was sickness/health with a technical profit of 143.4 with a loss of 95.6 million USD, credit insurance with 3.2 million
million USD and a profit growth of 90.7 percent. Accident line was USD, aviation with 2.5 million USD, ships insurance with 868
followed by fire and natural forces with a technical profitability of thousand USD, assistance with 8.1 thousand USD and rolling
127.8 million USD and a profit growth of 94.8 percent. stock with 1.9 thousand USD.
Technical profit and loss in traffic and motor casco by years (million USD)
200
100
127
74 77 49 51
0
2014 Q4 2015 Q4 2016 Q4 2017 Q4 2018 Q4
-‐91
-‐100 -‐150 -‐137
MOTOR CASCO
TRAFFIC
-‐200 -‐405
-‐300
-‐400
-‐500
Technical profit and loss in selected lines by quarters (USD)
ACCIDENT LAND VEHICLES GENERAL LOSSES LAND VEHICLES MARINE FIRE AND NATURAL SICKNESS/HEALTH LEGAL PROTECTION FINANCIAL AVIATION BOND INSURANCE CREDIT GENERAL LOSS-
LIABILITY FORCES LOSSES LIABILITY ES
2014 Q4 59.990.599 127.801.035 28.294.842 116.347.309 27.955.452 51.278.986 20.376.858 8.514.335 4.279.509 72.638 10.881 (1.621.743 27.413.086
2015 Q4 68.366.761 74.603.096 31.954.407 358.774.577 25.134.668 46.647.695 30.753.880 11.287.716 5.019.615 501.083 (4.905 (8.367.790 5.076.123
2016 Q4 82.537.406 77.780.214 39.439.694 35.369.554 28.412.925 23.143.179 21.850.429 11.235.341 6.259.622 423.508 (125.909 (5.154.338 14.648.089
2017 Q4 130.618.036 49.223.708 60.057.886 55.945.468 35.432.359 65.582.453 75.162.384 28.442.471 9.439.560 396.569 1.489.700 587.727 14.743.583
2018 Q4 170.365.099 51.813.266 64.949.426 95.557.898 60.269.546 127.817.062 143.368.982 30.455.715 1.439.615 556.946 3.041.337 (3.247.920 4.083.051