
Page 19 - Turkinsurance Digital Magazine
P. 19
17
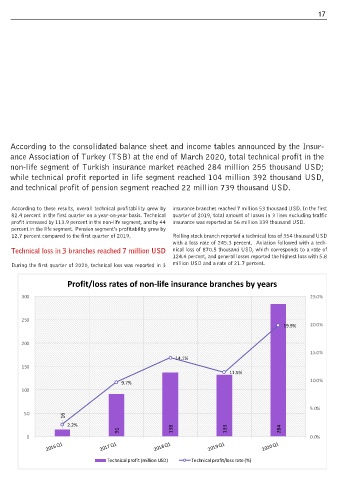
According to the consolidated balance sheet and income tables announced by the Insur-
ance Association of Turkey (TSB) at the end of March 2020, total technical profit in the
non-life segment of Turkish insurance market reached 284 million 255 thousand USD;
while technical profit reported in life segment reached 104 million 392 thousand USD,
and technical profit of pension segment reached 22 million 739 thousand USD.
According to these results, overall technical profitability grew by insurance branches reached 7 million 53 thousand USD. In the first
82.4 percent in the first quarter on a year-on-year basis. Technical quarter of 2019, total amount of losses in 3 lines excluding traffic
profit increased by 113.9 percent in the non-life segment, and by 44 insurance was reported as 56 million 339 thousand USD.
percent in the life segment. Pension segment’s profitability grew by
12.7 percent compared to the first quarter of 2019. Rolling stock branch reported a technical loss of 354 thousand USD
with a loss rate of 245.3 percent. Aviation followed with a tech-
Technical loss in 3 branches reached 7 million USD nical loss of 870.5 thousand USD, which corresponds to a rate of
124.4 percent, and general losses reported the highest loss with 5.8
During the first quarter of 2020, technical loss was reported in 3 million USD and a rate of 21.7 percent.
Profit/loss rates of non-life insurance branches by years
300 25.0%
250
19.9% 20.0%
200
15.0%
14.1%
150
11.5%
9.7% 10.0%
100
5.0%
50 16
2.2%
91 138 133 284
0 0.0%
2016 Q1 2017 Q1 2018 Q1 2019 Q1 2020 Q1
Technical profit (million USD) Technical profit/loss rate (%)