
Page 28 - Turkinsurance Digital Magazine
P. 28
28
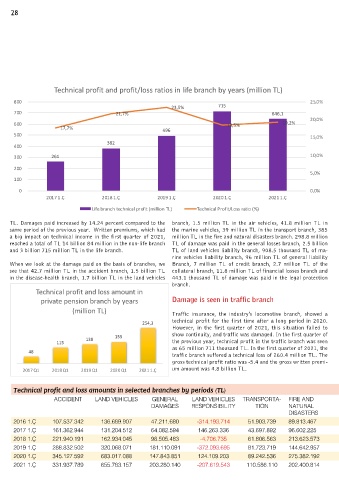
Technical profit and profit/loss ratios in life branch by years (million TL)
800 25,0%
23,5% 715
700 21,7% 646,1
20,0%
600 18,5% 19,2%
17,7% 496
500 15,0%
382
400
300 261 10,0%
200
5,0%
100
0 0,0%
2017 1.Ç 2018 1.Ç 2019 1.Ç 2020 1.Ç 2021 1.Ç
Life branch technical profit (million TL) Technical Profit/Loss ratio (%)
TL. Damages paid increased by 14.24 percent compared to the branch, 1.5 million TL in the air vehicles, 41.8 million TL in
same period of the previous year. Written premiums, which had the marine vehicles, 39 million TL in the transport branch, 385
a big impact on technical income in the first quarter of 2021, million TL in the fire and natural disasters branch. 298.8 million
reached a total of TL 14 billion 84 million in the non-life branch TL of damage was paid in the general losses branch, 2.5 billion
and 3 billion 715 million TL in the life branch. TL of land vehicles liability branch, 908.5 thousand TL of ma-
rine vehicles liability branch, 96 million TL of general liability
When we look at the damage paid on the basis of branches, we Branch, 7 million TL of credit branch, 2.7 million TL of the
see that 42.7 million TL in the accident branch, 1.5 billion TL collateral branch, 11.8 million TL of financial losses branch and
in the disease-health branch, 1.7 billion TL in the land vehicles 443.1 thousand TL of damage was paid in the legal protection
branch.
Technical profit and loss amount in
private pension branch by years Damage is seen in traffic branch
(million TL)
Traffic insurance, the industry's locomotive branch, showed a
254,3 technical profit for the first time after a long period in 2020.
However, in the first quarter of 2021, this situation failed to
155 show continuity, and traffic was damaged. In the first quarter of
138
115 the previous year, technical profit in the traffic branch was seen
as 65 million 711 thousand TL. In the first quarter of 2021, the
48
traffic branch suffered a technical loss of 260.4 million TL. The
gross technical profit ratio was -5.4 and the gross written premi-
2017 Q1 2018 Q1 2019 Q1 2020 Q1 2021 1.Ç um amount was 4.8 billion TL.
Technical profit and loss amounts in selected branches by periods (TL)
ACCIDENT LAND VEHICLES GENERAL LAND VEHICLES TRANSPORTA- FIRE AND DISEASE-HEALTH LEGAL FINANCIAL AIR VEHICLES BAIL CREDIT GENERAL
DAMAGES RESPONSIBILITY TION NATURAL PROTECTION LOSSES RESPONSIBILITY LIABILITY
DISASTERS
2016 1.Ç 107.537.342 136.689.907 47.211.680 -314.193.714 51.903.739 89.813.467 16.151.694 15.367.000 5.338.421 -979.020 -116.790 -26.937.403 -33.593.731
2017 1.Ç 161.362.944 131.204.512 64.082.594 146.263.336 43.697.892 96.602.225 60.306.650 29.259.968 4.669.922 -342.677 -3.572.180 -1.678.445 -105.906.906
2018 1.Ç 221.940.191 162.934.045 98.505.483 -4.706.735 61.806.563 213.623.573 73.725.994 47.144.549 17.441.718 996.000 8.677.316 1.307.552 32.223.883
2019 1.Ç 288.832.502 320.068.071 181.110.091 -372.093.695 81.723.719 144.642.957 163.175.134 46.569.413 20.339.636 2.667.699 318.988 -13.805.857 36.460.640
2020 1.Ç 345.127.592 683.017.088 147.843.851 124.109.203 89.242.536 275.382.192 255.660.907 37.453.619 13.938.378 499.676 8.279.406 5.633.391 -39.927.558
2021 1.Ç 331.937.789 655.783.157 203.280.140 -207.619.543 110.586.110 202.400.814 682.019.970 55.679.170 7.519.872 919.715 11.825.762 -599.743 -83.880.006