
Page 29 - Turkinsurance Digital Magazine
P. 29
29
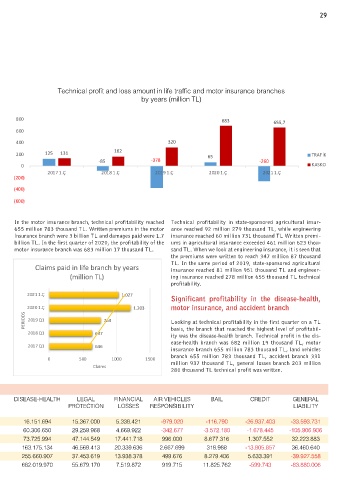
Technical profit and loss amount in life traffic and motor insurance branches
Yıllar itibarıyla hayat trafik ve kasko branşlarında teknik kar ve zarar tutarları
by years (million TL)
(milyon TL)
800 683 655,7
600
400 320
200 125 131 162 65 TRAFİK
-85 -378 -260
0 KASKO
2017 1.Ç 2018 1.Ç 2019 1.Ç 2020 1.Ç 2021 1.Ç
(200)
(400)
(600)
In the motor insurance branch, technical profitability reached Technical profitability in state-sponsored agricultural insur-
655 million 783 thousand TL. Written premiums in the motor ance reached 92 million 279 thousand TL, while engineering
insurance branch were 3 billion TL and damages paid were 1.7 insurance reached 60 million 731 thousand TL Written premi-
billion TL. In the first quarter of 2020, the profitability of the ums in agricultural insurance exceeded 461 million 623 thou-
motor insurance branch was 683 million 17 thousand TL. sand TL. When we look at engineering insurance, it is seen that
the premiums were written to reach 347 million 87 thousand
Claims paid in life branch by years TL. In the same period of 2019, state-sponsored agricultural
insurance reached 81 million 951 thousand TL and engineer-
(million TL) ing insurance reached 278 million 655 thousand TL technical
profitability.
2021 1.Ç 1.027
Significant profitability in the disease-health,
2020 1.Ç 1.203 motor insurance, and accident branch
PERIODS 2019 Q1 763 Looking at technical profitability in the first quarter on a TL
2018 Q1 637 basis, the branch that reached the highest level of profitabil-
ity was the disease-health branch. Technical profit in the dis-
ease-health branch was 682 million 19 thousand TL, motor
2017 Q1 636
insurance branch 655 million 783 thousand TL, land vehicles
0 500 1000 1500 branch 655 million 783 thousand TL, accident branch 331
Claims million 937 thousand TL, general losses branch 203 million
280 thousand TL technical profit was written.
Technical profit and loss amounts in selected branches by periods (TL)
ACCIDENT LAND VEHICLES GENERAL LAND VEHICLES TRANSPORTA- FIRE AND DISEASE-HEALTH LEGAL FINANCIAL AIR VEHICLES BAIL CREDIT GENERAL
DAMAGES RESPONSIBILITY TION NATURAL PROTECTION LOSSES RESPONSIBILITY LIABILITY
DISASTERS
2016 1.Ç 107.537.342 136.689.907 47.211.680 -314.193.714 51.903.739 89.813.467 16.151.694 15.367.000 5.338.421 -979.020 -116.790 -26.937.403 -33.593.731
2017 1.Ç 161.362.944 131.204.512 64.082.594 146.263.336 43.697.892 96.602.225 60.306.650 29.259.968 4.669.922 -342.677 -3.572.180 -1.678.445 -105.906.906
2018 1.Ç 221.940.191 162.934.045 98.505.483 -4.706.735 61.806.563 213.623.573 73.725.994 47.144.549 17.441.718 996.000 8.677.316 1.307.552 32.223.883
2019 1.Ç 288.832.502 320.068.071 181.110.091 -372.093.695 81.723.719 144.642.957 163.175.134 46.569.413 20.339.636 2.667.699 318.988 -13.805.857 36.460.640
2020 1.Ç 345.127.592 683.017.088 147.843.851 124.109.203 89.242.536 275.382.192 255.660.907 37.453.619 13.938.378 499.676 8.279.406 5.633.391 -39.927.558
2021 1.Ç 331.937.789 655.783.157 203.280.140 -207.619.543 110.586.110 202.400.814 682.019.970 55.679.170 7.519.872 919.715 11.825.762 -599.743 -83.880.006