
Page 37 - Turkinsurance Digital Magazine
P. 37
37
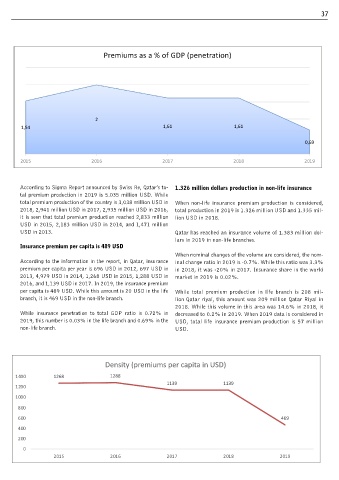
Premiums as a % of GDP (penetration)
2
1,54 1,61 1,61
0,69
2015 2016 2017 2018 2019
According to Sigma Report announced by Swiss Re, Qatar’s to- 1.326 million dollars production in non-life insurance
tal premium production in 2019 is 5.035 million USD. While
total premium production of the country is 3,038 million USD in When non-life insurance premium production is considered,
2018, 2,941 million USD in 2017, 2,935 million USD in 2016, total production in 2019 is 1.326 million USD and 1.335 mil-
it is seen that total premium production reached 2,833 million lion USD in 2018.
USD in 2015, 2,183 million USD in 2014, and 1,471 million
USD in 2013. Qatar has reached an insurance volume of 1.383 million dol-
lars in 2019 in non-life branches.
Insurance premium per capita is 489 USD
When nominal changes of the volume are considered, the nom-
According to the information in the report, in Qatar, insurance inal change ratio in 2019 is -0.7%. While this ratio was 3.3%
premium per capita per year is 696 USD in 2012, 697 USD in in 2018, it was -20% in 2017. Insurance share in the world
2013, 4,979 USD in 2014, 1,268 USD in 2015, 1,288 USD in market in 2019 is 0.02%.
2016, and 1,139 USD in 2017. In 2019, the insurance premium
per capita is 489 USD. While this amount is 20 USD in the life While total premium production in life branch is 208 mil-
branch, it is 469 USD in the non-life branch. lion Qatar riyal, this amount was 209 million Qatar Riyal in
2018. While this volume in this area was 14.6% in 2018, it
While insurance penetration to total GDP ratio is 0.72% in decreased to 0.2% in 2019. When 2019 data is considered in
2019, this number is 0.03% in the life branch and 0.69% in the USD, total life insurance premium production is 57 million
non-life branch. USD.
Density (premiums per capita in USD)
1400 1268 1288
1139 1139
1200
1000
800
600 469
400
200
0
2015 2016 2017 2018 2019