
Page 19 - Turkinsurance Digital Magazine
P. 19
19
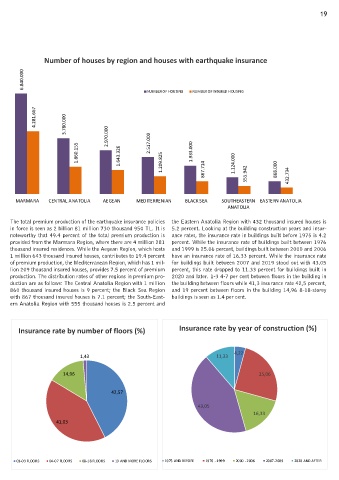
Number of houses by region and houses with earthquake insurance
6.840.000
NUMBER OF HOUSING NUMBER OF INSURED HOUSING
4.281.667 3.780.000
1.860.155 2.970.000 1.643.326 2.517.000 1.209.825 1.933.000 867.714 1.124.000 555.942 868.000 432.734
MARMARA CENTRAL ANATOLIA AEGEAN MEDITERRENIAN BLACK SEA SOUTHEASTERN EASTERN ANATOLIA
ANATOLIA
The total premium production of the earthquake insurance policies the Eastern Anatolia Region with 432 thousand insured houses is
in force is seen as 2 billion 81 million 730 thousand 950 TL. It is 5.2 percent. Looking at the building construction years and insur-
noteworthy that 49.4 percent of the total premium production is ance rates, the insurance rate in buildings built before 1975 is 4.2
provided from the Marmara Region, where there are 4 million 281 percent. While the insurance rate of buildings built between 1976
thousand insured residences. While the Aegean Region, which hosts and 1999 is 25.06 percent, buildings built between 2000 and 2006
1 million 643 thousand insured houses, contributes to 19.4 percent have an insurance rate of 16.33 percent. While the insurance rate
of premium production, the Mediterranean Region, which has 1 mil- for buildings built between 2007 and 2019 stood out with 43.05
lion 209 thousand insured houses, provides 7.5 percent of premium percent, this rate dropped to 11.33 percent for buildings built in
production. The distribution rates of other regions in premium pro- 2020 and later. 1-3 4-7 per cent between floors in the building in
duction are as follows: The Central Anatolia Region with 1 million the building between floors while 41,3 insurance rate 42,5 percent,
860 thousand insured houses is 9 percent; the Black Sea Region and 19 percent between floors in the building 14,96 8-18-storey
with 867 thousand insured houses is 7.1 percent; the South-East- buildings is seen as 1.4 per cent.
ern Anatolia Region with 555 thousand houses is 2.5 percent and
Insurance rate by number of floors (%) Insurance rate by year of construction (%)
4,22
1,43 11,33
14,96 25,06
42,57
43,05
16,33
41,03
01-03 FLOORS 04-07 FLOORS 08-18 FLOORS 19 AND MORE FLOORS 1975 AND BEFORE 1976 - 1999 2000 - 2006 2007-2009 2020 AND AFTER