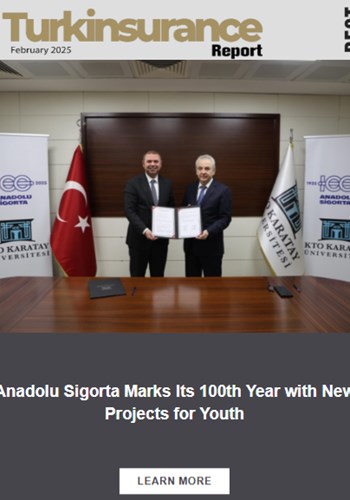
Anadolu Sigorta Achieves 8.6 Billion TL Profit in the First Nine Months of 2025
Compared to the same period of last year, Anadolu Sigorta increased its premium production by 46%. The company’s total assets reached 122.1 billion TL, while its investment portfolio grew by 30.2% since the beginning of the year, reaching 72.3 billion TL.
Maintaining its profitability-focused production strategy into its second century, the Company recorded 46% growth in premium production and achieved a net profit of 8.6 billion TL as of the end of the ninth month of 2025. Shareholders’ equity reached 36.2 billion TL, with an average return on equity of 36.4%.
Thanks to its strong performance, the Company’s third-quarter net profit reached 3.4 billion TL, marking growth compared to both the second quarter of 2025 and the same quarter of the previous year. Net profit increased by 40.4% compared to the same quarter last year, and by 15.8% compared to the second quarter of 2025.
Consolidated net profit reached 9 billion TL, an 8.2% increase year-on-year. According to the announced results, the branch in which Anadolu Sigorta generated the highest premium volume was Motor Third-Party Liability with 15.2 billion TL. This was followed by Health with 14 billion TL, Fire and Natural Disasters with 13 billion TL, and Motor Vehicles with 12.4 billion TL.
Premium production of Anadolu Sigorta for the first nine months of 2025 by branches is as follows:
|
|
09.2025 |
09.2024 |
Change (%) |
|
09.25-09.24 |
|||
|
ACCIDENT |
1,473,323,675 |
892,367,797 |
65.1 |
|
HEALTH/INSURANCE |
13,980,823,791 |
8,189,018,116 |
70.7 |
|
MOTOR VEHICLES |
12,443,102,172 |
10,250,734,614 |
21.4 |
|
AIRCRAFT |
504,586,293 |
573,556,435 |
-12.0 |
|
SEA VEHICLES |
1,710,680,280 |
1,207,088,872 |
41.7 |
|
TRANSPORTATION |
1,323,267,261 |
1,103,799,149 |
19.9 |
|
FIRE AND NATURAL DISASTERS |
12,994,222,575 |
10,042,145,549 |
29.4 |
|
GENERAL DAMAGES |
4,353,720,714 |
3,107,165,287 |
40.1 |
|
MOTOR THIRD-PARTY LIABILITY |
15,173,657,961 |
8,754,256,595 |
73.3 |
|
AIRCRAFT LIABILITY |
318,708,744 |
384,925,735 |
-17.2 |
|
GENERAL LIABILITY |
1,928,772,337 |
1,172,227,999 |
64.5 |
|
CREDIT |
48,780,086 |
33,812,427 |
44.3 |
|
SURETY |
40,420,999 |
180,780,888 |
-77.6 |
|
FINANCIAL LOSSES |
501,308,196 |
377,162,374 |
32.9 |
|
LEGAL PROTECTION |
1,122,829,444 |
290,062,424 |
287.1 |
|
NON-LIFE TOTAL |
67,918,204,528 |
46,559,104,261 |
45.9 |
|
LIFE INSURANCE |
0 |
0 |
|
|
OVERALL TOTAL |
67,918,204,528 |
46,559,104,261 |
45.9 |
website.gif "TURASSIST")
.gif "RS")