
Page 20 - TurkInsurance Digital Magazine
P. 20
18
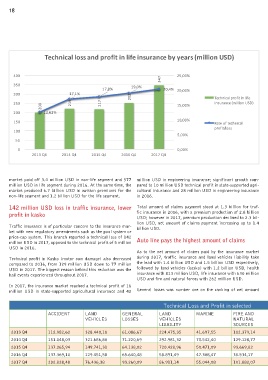
Technical loss and profit in life insurance by years (million USD)
400 25,00%
347
350 19,0%
17,8% 20,4% 20,00%
300 17,1% 252 Technical profit in life
250 219 217 insurance (million USD)
200 15,00%
200 12,62%
150 10,00% Rate of technical
profit/loss
100
5,00%
50
0 0,00%
2013 Q4 2014 Q4 2015 Q4 2016 Q4 2017 Q4
market paid off 3.4 million USD in non-life segment and 577 million USD in engineering insurance; significant growth com-
million USD in life segment during 2016. At the same time, the pared to 10 million USD technical profit in state-supported agri-
market produced 6.7 billion USD in written premiums for the cultural insurance and 28 million USD in engineering insurance
non-life segment and 1.2 billion USD for the life segment. in 2016.
142 million USD loss in traffic insurance, lower Total amount of claims payment stood at 1.3 billion for traf-
profit in kasko fic insurance in 2016, with a premium production of 2.8 billion
USD; however in 2017, premium production declined to 2.3 bil-
lion USD, net amount of claims payment increasing up to 1.4
Traffic insurance is of particular concern to the insurance mar- billion USD.
ket with new regulatory amendments such as the pool system or
price-cap system. This branch reported a technical loss of 142 Auto line pays the highest amount of claims
million USD in 2017, opposed to the technical profit of 5 million
USD in 2016.
As to the net amount of claims paid by the insurance market
Technical profit in Kasko (motor own damage) also decreased during 2017, traffic insurance and land vehicles liability take
compared to 2016, from 129 million USD down to 77 million the lead with 1.4 billion USD and 1.5 billion USD respectively,
USD in 2017. The biggest reason behind this reduction was the followed by land vehicles (kasko) with 1.2 billion USD, health
hail events experienced throughout 2017. insurance with 813 million USD, life insurance with 630 million
USD and fire and natural forces with 262 million USD.
In 2017, the insurance market reached a technical profit of 16
million USD in state-supported agricultural insurance and 42 General losses was number one on the ranking of net amount
Technical Loss and Profit in selected insurance lines by quarters (thousand USD)
ACCIDENT LAND GENERAL LAND MARINE FIRE AND SICKNESS- LEGAL FINANCIAL AVIATION BOND CREDIT GENERAL
VEHICLES LOSSES VEHICLES NATURAL HEALTH PROTECTION LOSSES LIABILITY INSURANCE LIABILITY
LIABILITY SOURCES
2013 Q4 112.982,62 328.440,10 61.086,67 224.475,35 41.697,55 102.379,14 52.687,88 15.845,75 8.685,74 199,72 232,46 8.966,00 66.942,78
2014 Q4 151.048,03 321.686,80 71.220,69 292.981,32 70.542,40 129.128,77 51.298,26 21.434,64 10.773,56 182,86 27,40 4.083,47 69.024,71
2015 Q4 137.265,94 149.741,31 64.138,02 720.428,96 50.471,09 93.669,82 61.737,81 22.659,87 10.076,78 1.006,10 9,85 16.801,32 10.192,13
2016 Q4 137.369,10 129.451,58 65.640,48 58.891,49 47.308,47 38.534,17 36.371,79 18.702,13 10.419,64 705,10 209,63 8.581,42 24.387,07
2017 Q4 202.828,48 76.436,38 93.260,09 86.911,14 55.044,08 101.882,07 116.732,79 44.173,28 14.660,34 616,02 2.314,05 912,96 22.901,78