
Page 21 - TurkInsurance Digital Magazine
P. 21
19
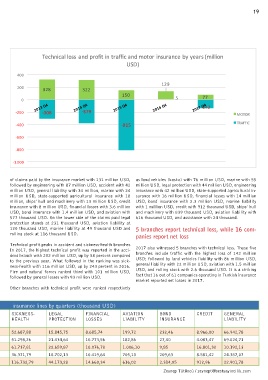
Technical loss and profit in traffic and motor insurance by years (million
USD)
400
129
200 328 322
150
0 5 77
-142
-200 -306 -379 MOTOR
-400 -815 TRAFFIC
-600
-800
-1.000
of claims paid by the insurance market with 131 million USD, as land vehicles (kasko) with 76 million USD, marine with 55
followed by engineering with 87 million USD, accident with 42 million USD, legal protection with 44 million USD, engineering
million USD, general liability with 34 million, marine with 24 insurance with 42 million USD, state-supported agricultural in-
million USD, state-supported agricultural insurance with 18 surance with 16 million USD, financial losses with 14 million
million, ships’ hull and machinery with 13 million USD, credit USD, bond insurance with 2.3 million USD, marine liability
insurance with 8 million USD, financial losses with 3.6 million with 1 million USD, credit with 912 thousand USD, ships’ hull
USD, bond insurance with 1.4 million USD, and aviation with and machinery with 839 thousand USD, aviation liability with
577 thousand USD. On the lower side of the claims paid legal 616 thousand USD, and assistance with 24 thousand.
protection stands at 231 thousand USD, aviation liability at
120 thousand USD, marine liability at 49 thousand USD and 5 branches report technical loss, while 16 com-
rolling stock at 116 thousand USD.
panies report net loss
Technical profit peaks in accident and sickness-health branches
In 2017, the highest technical profit was reported in the acci- 2017 also witnessed 5 branches with technical loss. Those five
dent branch with 202 million USD, up by 58 percent compared branches include traffic with the highest loss of 142 million
to the previous year. What followed in the ranking was sick- USD; followed by land vehicles liability with 86 million USD,
ness-health with 116 million USD, up by 243 percent in 2016. general liability with 22 million USD, aviation with 1.5 million
Fire and natural forces ranked third with 101 million USD, USD, and rolling stock with 2.6 thousand USD. It is a striking
followed by general losses with 93 million USD. fact that 16 out of 61 companies operating in Turkish insurance
market reported net losses in 2017.
Other branches with technical profit were ranked respectively
Technical Loss and Profit in selected insurance lines by quarters (thousand USD)
ACCIDENT LAND GENERAL LAND MARINE FIRE AND SICKNESS- LEGAL FINANCIAL AVIATION BOND CREDIT GENERAL
VEHICLES LOSSES VEHICLES NATURAL HEALTH PROTECTION LOSSES LIABILITY INSURANCE LIABILITY
LIABILITY SOURCES
2013 Q4 112.982,62 328.440,10 61.086,67 224.475,35 41.697,55 102.379,14 52.687,88 15.845,75 8.685,74 199,72 232,46 8.966,00 66.942,78
2014 Q4 151.048,03 321.686,80 71.220,69 292.981,32 70.542,40 129.128,77 51.298,26 21.434,64 10.773,56 182,86 27,40 4.083,47 69.024,71
2015 Q4 137.265,94 149.741,31 64.138,02 720.428,96 50.471,09 93.669,82 61.737,81 22.659,87 10.076,78 1.006,10 9,85 16.801,32 10.192,13
2016 Q4 137.369,10 129.451,58 65.640,48 58.891,49 47.308,47 38.534,17 36.371,79 18.702,13 10.419,64 705,10 209,63 8.581,42 24.387,07
2017 Q4 202.828,48 76.436,38 93.260,09 86.911,14 55.044,08 101.882,07 116.732,79 44.173,28 14.660,34 616,02 2.314,05 912,96 22.901,78
Zeynep Tütüncü / zeynept@bestyayincilik.com