
Page 21 - Turkinsurance Digital Magazine
P. 21
19
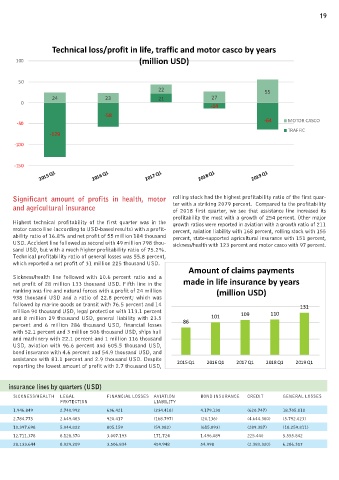
Technical loss/profit in life, traffic and motor casco by years
100 (million USD)
50
22 55
24 23 21 27
0
-14
-58
-50 -64 MOTOR CASCO
TRAFFIC
-129
-100
-150
2015 Q1 2016 Q1 2017 Q1 2018 Q1 2019 Q1
Significant amount of profits in health, motor rolling stock had the highest profitability ratio of the first quar-
and agricultural insurance ter with a striking 2079 percent. Compared to the profitability
of 2018 first quarter, we see that assistance line increased its
profitability the most with a growth of 254 percent. Other major
Highest technical profitability of the first quarter was in the growth ratios were reported in aviation with a growth ratio of 211
motor casco line (according to USD-based results) with a profit- percent, aviation liability with 168 percent, rolling stock with 155
ability ratio of 16.8% and net profit of 55 million 184 thousand percent, state-supported agricultural insurance with 151 percent,
USD. Accident line followed as second with 49 million 798 thou- sickness/health with 123 percent and motor casco with 97 percent.
sand USD, but with a much higher profitability ratio of 75.2%.
Technical profitability ratio of general losses was 55.8 percent,
which reported a net profit of 31 million 225 thousand USD.
Amount of claims payments
Sickness/health line followed with 10.6 percent ratio and a
net profit of 28 million 133 thousand USD. Fifth line in the made in life insurance by years
ranking was fire and natural forces with a profit of 24 million (million USD)
938 thousand USD and a ratio of 22.8 percent; which was
followed by marine goods on transit with 76.5 percent and 14 131
million 90 thousand USD, legal protection with 113.1 percent 109 110
and 8 million 29 thousand USD, general liability with 23.5 86 101
percent and 6 million 286 thousand USD, financial losses
with 52.1 percent and 3 million 506 thousand USD, ships hull
and machinery with 22.1 percent and 1 million 116 thousand
USD, aviation with 96.6 percent and 605.5 thousand USD,
bond insurance with 4.6 percent and 54.9 thousand USD, and
assistance with 81.1 percent and 2.9 thousand USD. Despite 2015 Q1 2016 Q1 2017 Q1 2018 Q1 2019 Q1
reporting the lowest amount of profit with 2.7 thousand USD,
Technical profit and loss in selected insurance lines by quarters (USD)
ACCIDENT LAND VEHICLES GENERAL LOSSES LAND VEHICLES LI- MARINE GOODS ON FIRA AND NATURAL SICKNESS/HEALTH LEGAL FINANCIAL LOSSES AVIATION BOND INSURANCE CREDIT GENERAL LOSSES
ABILITY TRANSIT FORCES PROTECTION LIABILITY
2015 Q1 13.742.415 24.611.930 8.738.033 (116.294.659) 7.660.848 5.088.565 1.946.849 2.740.992 636.421 (234.418) 4.179.130 (620.747) 18.705.818
2016 Q1 18.540.921 23.567.225 8.139.945 (54.171.330) 8.948.920 15.485.081 2.784.775 2.649.483 920.417 (168.797) (20.136) (4.644.380) (5.792.023)
2017 Q1 27.821.197 22.621.468 11.048.723 25.217.817 7.534.119 16.655.556 10.397.698 5.044.822 805.159 (59.082) (615.893) (289.387) (18.259.811)
2018 Q1 38.265.550 28.092.077 16.983.704 (811.506) 10.656.304 36.831.650 12.711.378 8.128.370 3.007.193 171.724 1.496.089 225.440 5.555.842
2019 Q1 49.798.707 55.184.150 31.225.878 (64.154.085) 14.090.296 24.938.441 28.133.644 8.029.209 3.506.834 459.948 54.998 (2.380.320) 6.286.317