
Page 20 - Turkinsurance Digital Magazine
P. 20
18
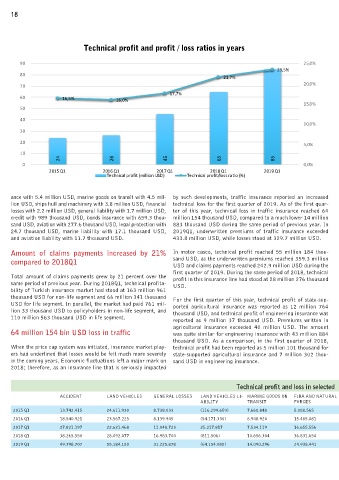
Technical profit and profit / loss ratios in years
Yıllar itibarıyla hayat branşında teknik kar ve kar/zarar oranları
90 25,0%
23,5%
80 21,7%
70 20,0%
17,7%
60 16,5% 16,0%
15,0%
50
40
10,0%
30
20 5,0%
10
24 26 45 65 85
0 0,0%
2015 Q1 2016 Q1 2017 Q1 2018 Q1 2019 Q1
Technical profit (million USD) Technical profit/loss ratio (%)
ance with 5.4 million USD, marine goods on transit with 4.5 mil- by such developments, traffic insurance reported an increased
lion USD, ships hull and machinery with 3.8 million USD, financial technical loss for the first quarter of 2019. As of the first quar-
losses with 2.2 million USD, general liability with 1.7 million USD, ter of this year, technical loss in traffic insurance reached 64
credit with 989 thousand USD, bonds insurance with 659.3 thou- million 154 thousand USD, compared to a much lower 14 million
sand USD, aviation with 277.6 thousand USD, legal protection with 883 thousand USD during the same period of previous year. In
24.7 thousand USD, marine liability with 17.1 thousand USD, 2019Q1, underwritten premiums of traffic insurance exceeded
and aviation liability with 11.7 thousand USD. 433.8 million USD, while losses stood at 329.7 million USD.
Amount of claims payments increased by 21% In motor casco, technical profit reached 55 million 184 thou-
compared to 2018Q1 sand USD, as the underwritten premiums reached 359.3 million
USD and claims payments reached 242.9 million USD during the
first quarter of 2019. During the same period of 2018, technical
Total amount of claims payments grew by 21 percent over the profit in this insurance line had stood at 28 million 276 thousand
same period of previous year. During 2018Q1, technical profita- USD.
bility of Turkish insurance market had stood at 163 million 961
thousand USD for non-life segment and 66 million 341 thousand For the first quarter of this year, technical profit of state-sup-
USD for life segment. In parallel, the market had paid 761 mil- ported agricultural insurance was reported as 12 million 764
lion 33 thousand USD to policyholders in non-life segment, and thousand USD, and technical profit of engineering insurance was
110 million 563 thousand USD in life segment.
reported as 9 million 37 thousand USD. Premiums written in
agricultural insurance exceeded 40 million USD. The amount
64 million 154 bin USD loss in traffic was quite similar for engineering insurance with 43 million 884
thousand USD. As a comparison, in the first quarter of 2018,
When the price cap system was initiated, insurance market play- technical profit had been reported as 5 million 101 thousand for
ers had underlined that losses would be felt much more severely state-supported agricultural insurance and 7 million 302 thou-
in the coming years. Economic fluctuations left a major mark on sand USD in engineering insurance.
2018; therefore, as an insurance line that is seriously impacted
Technical profit and loss in selected insurance lines by quarters (USD)
ACCIDENT LAND VEHICLES GENERAL LOSSES LAND VEHICLES LI- MARINE GOODS ON FIRA AND NATURAL SICKNESS/HEALTH LEGAL FINANCIAL LOSSES AVIATION BOND INSURANCE CREDIT GENERAL LOSSES
ABILITY TRANSIT FORCES PROTECTION LIABILITY
2015 Q1 13.742.415 24.611.930 8.738.033 (116.294.659) 7.660.848 5.088.565 1.946.849 2.740.992 636.421 (234.418) 4.179.130 (620.747) 18.705.818
2016 Q1 18.540.921 23.567.225 8.139.945 (54.171.330) 8.948.920 15.485.081 2.784.775 2.649.483 920.417 (168.797) (20.136) (4.644.380) (5.792.023)
2017 Q1 27.821.197 22.621.468 11.048.723 25.217.817 7.534.119 16.655.556 10.397.698 5.044.822 805.159 (59.082) (615.893) (289.387) (18.259.811)
2018 Q1 38.265.550 28.092.077 16.983.704 (811.506) 10.656.304 36.831.650 12.711.378 8.128.370 3.007.193 171.724 1.496.089 225.440 5.555.842
2019 Q1 49.798.707 55.184.150 31.225.878 (64.154.085) 14.090.296 24.938.441 28.133.644 8.029.209 3.506.834 459.948 54.998 (2.380.320) 6.286.317