
Page 27 - Turkinsurance Digital Magazine
P. 27
25
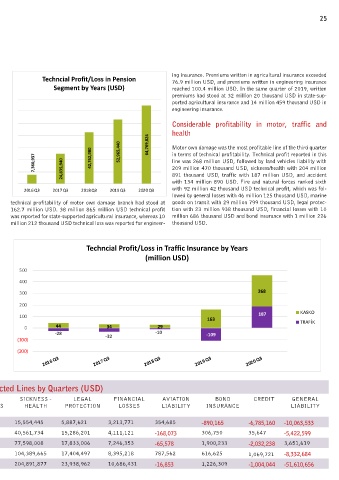
Techncial Profit/Loss in Pension ing insurance. Premiums written in agricultural insurance exceeded
76.9 million USD, and premiums written in engineering insurance
Segment by Years (USD) reached 100.4 million USD. In the same quarter of 2019, written
premiums had stood at 32 million 20 thousand USD in state-sup-
ported agricultural insurance and 14 million 459 thousand USD in
engineering insurance.
Considerable profitability in motor, traffic and
health
64,769,824
Motor own damage was the most profitable line of the third quarter
7,360,937 24,835,940 42,762,980 52,965,440 in terms of technical profitability. Technical profit reported in this
line was 268 million USD, followed by land vehicles liability with
209 million 470 thousand USD, sickness/health with 204 million
891 thousand USD, traffic with 187 million USD, and accident
with 134 million 890 USD. Fire and natural forces ranked sixth
2016 Q3 2017 Q3 2018 Q3 2019 Q3 2020 Q3 with 92 million 42 thousand USD technical profit, which was fol-
lowed by general losses with 46 million 125 thousand USD, marine
technical profitability of motor own damage branch had stood at goods on transit with 29 million 799 thousand USD, legal protec-
162.7 million USD. 38 million 865 million USD technical profit tion with 23 million 938 thousand USD, financial losses with 10
was reported for state-supported agricultural insurance, whereas 10 million 686 thousand USD and bond insurance with 1 million 226
million 212 thousand USD technical loss was reported for engineer- thousand USD.
Techncial Profit/Loss in Traffic Insurance by Years
(million USD)
500
400
300 268
200
100 163 187 KASKO
TRAFİK
0 44 34 29
-28 -32 -10 -109
(100)
(200)
2016 Q3 2017 Q3 2018 Q3 2019 Q3 2020 Q3
Techncial Profit/Loss in Selected Lines by Quarters (USD)
ACCIDENT LAND GENERAL LAND MARINE FIRE AND SICKNESS - LEGAL FINANCIAL AVIATION BOND CREDIT GENERAL
VEHICLES LOSSES VEHICLES NATURAL FORCES HEALTH PROTECTION LOSSES LIABILITY INSURANCE LIABILITY
LIABILITY
2016 Q3 46,801,518 44,162,876 25,120,163 -8,632,097 16,405,859 1,281,566 15,554,445 5,887,621 3,213,771 354,685 -890,165 -6,785,160 -10,063,533
2017 Q3 71,710,716 34,000,882 31,964,045 -16,483,936 19,388,442 28,911,265 40,561,734 15,286,201 4,111,121 -168,073 306,750 35,647 -5,422,599
2018 Q3 98,915,473 29,133,750 41,471,992 24,159,100 31,751,104 71,830,631 77,598,008 17,833,006 7,246,353 -65,578 1,900,233 -2,032,238 3,651,619
2019 Q3 119,266,680 162,914,365 66,765,463 -92,843,010 34,059,011 79,678,942 104,389,665 17,404,497 8,395,218 787,562 616,625 1,069,721 -8,332,684
2020 Q3 134,890,814 268,152,472 46,125,631 209,470,018 29,799,847 92,042,199 204,891,877 23,938,962 10,686,431 -16,853 1,226,309 -1,004,044 -51,610,656