
Page 26 - Turkinsurance Digital Magazine
P. 26
24
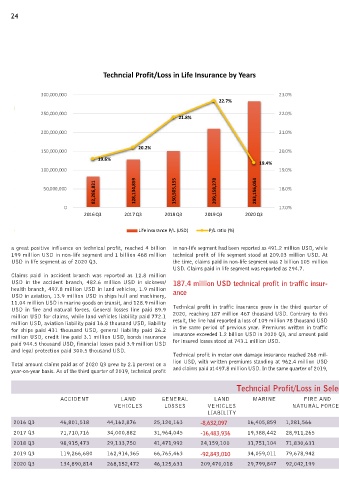
Techncial Profit/Loss in Life Insurance by Years
300,000,000 23.0%
22.7%
250,000,000 22.0%
21.8%
200,000,000 21.0%
20.2%
150,000,000 20.0%
19.6%
19.4%
100,000,000 19.0%
82,286,831 128,134,859 150,505,155 209,158,278 283,156,054
50,000,000 18.0%
0 17.0%
2016 Q3 2017 Q3 2018 Q3 2019 Q3 2020 Q3
Life insurance P/L (USD) P/L ratio (%)
a great positive influence on technical profit, reached 4 billion in non-life segment had been reported as 491.2 million USD, while
199 million USD in non-life segment and 1 billion 468 million technical profit of life segment stood at 209.03 million USD. At
USD in life segment as of 2020 Q3. the time, claims paid in non-life segment was 2 billion 105 million
USD. Claims paid in life segment was reported as 294.7.
Claims paid in accident branch was reported as 12.8 million
USD in the accident branch, 482.6 million USD in sickness/ 187.4 million USD technical profit in traffic insur-
health branch, 497.8 million USD in land vehicles, 1.9 million ance
USD in aviation, 13.9 million USD in ships hull and machinery,
11.04 million USD in marine goods on transit, and 128.9 million
USD in fire and natural forces. General losses line paid 89.9 Technical profit in traffic insurance grew in the third quarter of
million USD for claims, while land vehicles liability paid 772.1 2020, reaching 187 million 467 thousand USD. Contrary to this
million USD, aviation liability paid 16.8 thousand USD, liability result, the line had reported a loss of 109 million 78 thousand USD
for ships paid 431 thousand USD, general liability paid 26.2 in the same period of previous year. Premiums written in traffic
million USD, credit line paid 3.1 million USD, bonds insurance insurance exceeded 1.2 billion USD in 2020 Q3, and amount paid
paid 944.5 thousand USD, financial losses paid 3.9 million USD for insured losses stood at 743.1 million USD.
and legal protection paid 300.5 thousand USD.
Technical profit in motor own damage insurance reached 268 mil-
Total amount claims paid as of 2020 Q3 grew by 2.1 percent on a lion USD, with written premiums standing at 962.4 million USD
year-on-year basis. As of the third quarter of 2019, technical profit and claims paid at 497.8 million USD. In the same quarter of 2019,
Techncial Profit/Loss in Selected Lines by Quarters (USD)
ACCIDENT LAND GENERAL LAND MARINE FIRE AND SICKNESS - LEGAL FINANCIAL AVIATION BOND CREDIT GENERAL
VEHICLES LOSSES VEHICLES NATURAL FORCES HEALTH PROTECTION LOSSES LIABILITY INSURANCE LIABILITY
LIABILITY
2016 Q3 46,801,518 44,162,876 25,120,163 -8,632,097 16,405,859 1,281,566 15,554,445 5,887,621 3,213,771 354,685 -890,165 -6,785,160 -10,063,533
2017 Q3 71,710,716 34,000,882 31,964,045 -16,483,936 19,388,442 28,911,265 40,561,734 15,286,201 4,111,121 -168,073 306,750 35,647 -5,422,599
2018 Q3 98,915,473 29,133,750 41,471,992 24,159,100 31,751,104 71,830,631 77,598,008 17,833,006 7,246,353 -65,578 1,900,233 -2,032,238 3,651,619
2019 Q3 119,266,680 162,914,365 66,765,463 -92,843,010 34,059,011 79,678,942 104,389,665 17,404,497 8,395,218 787,562 616,625 1,069,721 -8,332,684
2020 Q3 134,890,814 268,152,472 46,125,631 209,470,018 29,799,847 92,042,199 204,891,877 23,938,962 10,686,431 -16,853 1,226,309 -1,004,044 -51,610,656