
Page 20 - Turkinsurance Digital Magazine
P. 20
18
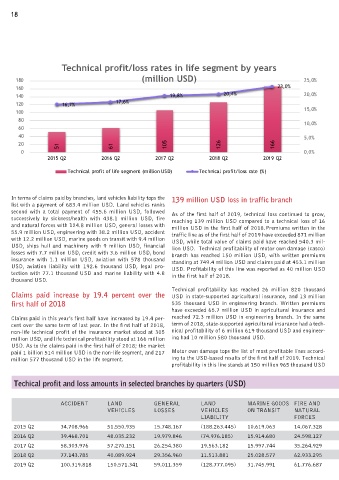
Technical profit/loss rates in life segment by years
180 (million USD) 25,0%
160 23,0%
140 19,8% 20,4% 20,0%
120 16,7% 17,6%
100 15,0%
80
10,0%
60
40 5,0%
20 51 61 105 126 166
0 0,0%
2015 Q2 2016 Q2 2017 Q2 2018 Q2 2019 Q2
Technical profit of life segment (million USD) Technical profit/loss rate (%)
In terms of claims paid by branches, land vehicles liability tops the 139 million USD loss in traffic branch
list with a payment of 683.4 million USD. Land vehicles ranks
second with a total payment of 455.6 million USD, followed As of the first half of 2019, technical loss continued to grow,
successively by sickness/health with 438.1 million USD, fire reaching 139 million USD compared to a technical loss of 16
and natural forces with 124.8 million USD, general losses with million USD in the first half of 2018.Premiums written in the
55.9 million USD, engineering with 38.2 million USD, accident traffic line as of the first half of 2019 have exceeded 871 million
with 12.2 million USD, marine goods on transit with 9.4 million USD, while total value of claims paid have reached 540.3 mil-
USD, ships hull and machinery with 9 million USD, financial lion USD. Technical profitability of motor own damage (casco)
losses with 7.7 million USD, credit with 3.6 million USD, bond branch has reached 150 million USD, with written premiums
insurance with 1.1 million USD, aviation with 578 thousand standing at 749.4 million USD and claims paid at 453.1 million
USD, aviation liability with 192.6 thousand USD, legal pro- USD. Profitability of this line was reported as 40 million USD
tection with 77.1 thousand USD and marine liability with 4.8 in the first half of 2018.
thousand USD.
Technical profitability has reached 26 million 820 thousand
Claims paid increase by 19.4 percent over the USD in state-supported agricultural insurance, and 13 million
first half of 2018 535 thousand USD in engineering branch. Written premiums
have exceeded 65.7 million USD in agricultural insurance and
Claims paid in this year’s first half have increased by 19.4 per- reached 72.3 million USD in engineering branch. In the same
cent over the same term of last year. In the first half of 2018, term of 2018, state-supported agricultural insurance had a tech-
non-life technical profit of the insurance market stood at 305 nical profitability of 6 million 619 thousand USD and engineer-
million USD, and life technical profitability stood at 166 million ing had 10 million 580 thousand USD.
USD. As to the claims paid in the first half of 2018; the market
paid 1 billion 514 million USD in the non-life segment, and 217 Motor own damage tops the list of most profitable lines accord-
million 577 thousand USD in the life segment. ing to the USD-based results of the first half of 2019. Technical
profitability in this line stands at 150 million 965 thousand USD
Techical profit and loss amounts in selected branches by quarters (USD)
ACCIDENT LAND GENERAL LAND MARINE GOODS FIRE AND SICKNESS/ LEGAL FINANCIAL AVIATION BOND CREDIT GENERAL
VEHICLES LOSSES VEHICLES ON TRANSIT NATURAL HEALTH PROTECTION LOSSES LIABILITY INSURANCE LIABILITY
LIABILITY FORCES
2015 Q2 34.708.966 51.550.935 15.748.167 (188.263.445) 10.619.063 14.067.328 8.052.388 5.645.783 2.135.403 (895.569) (511.460) (3.712.255) 14.306.400
2016 Q2 39.468.701 48.035.232 19.979.846 (74.976.185) 15.914.680 24.598.127 (5.657.467) 5.017.543 2.293.440 395.181 (199.250) (4.940.745) (10.385.668)
2017 Q2 58.303.976 57.270.151 26.254.380 19.563.182 15.997.744 35.264.929 18.385.301 11.030.751 3.102.478 (467.031) (3.838.963) 179.225 (19.773.364)
2018 Q2 77.143.785 40.089.924 29.356.960 11.513.881 25.028.577 62.933.295 36.710.488 15.475.284 6.331.058 (243.668) 1.497.357 (1.930.872) 399.501
2019 Q2 100.319.818 150.571.341 59.011.359 (128.777.095) 31.745.991 61.776.687 76.922.064 15.967.905 7.250.737 842.250 879.912 (1.576.680) (9.810.615)