
Page 21 - Turkinsurance Digital Magazine
P. 21
19
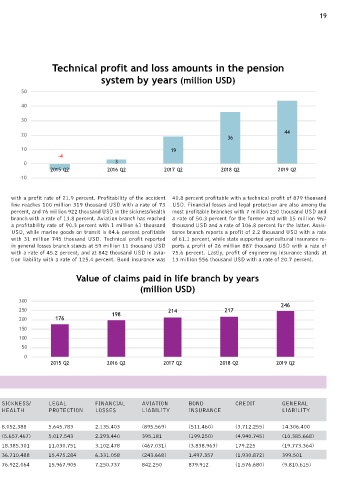
Technical profit and loss amounts in the pension
system by years (million USD)
50
40
30
44
20
36
10 19
-4
0 3
2015 Q2 2016 Q2 2017 Q2 2018 Q2 2019 Q2
-10
with a profit rate of 21.9 percent. Profitability of the accident 40.8 percent profitable with a technical profit of 879 thousand
line reaches 100 million 319 thousand USD with a rate of 73 USD. Financial losses and legal protection are also among the
percent, and 76 million 922 thousand USD in the sickness/health most profitable branches with 7 million 250 thousand USD and
branch with a rate of 13.8 percent. Aviation branch has reached a rate of 50.3 percent for the former and with 15 million 967
a profitability rate of 90.3 percent with 1 million 61 thousand thousand USD and a rate of 106.8 percent for the latter. Assis-
USD, while marine goods on transit is 84.6 percent profitable tance branch reports a profit of 2.2 thousand USD with a rate
with 31 million 745 thousand USD. Technical profit reported of 61.1 percent, while state supported agricultural insurance re-
in general losses branch stands at 59 million 11 thousand USD ports a profit of 26 million 887 thousand USD with a rate of
with a rate of 45.2 percent, and at 842 thousand USD in avia- 75.6 percent. Lastly, profit of engineering insurance stands at
tion liability with a rate of 125.4 percent. Bond insurance was 13 million 556 thousand USD with a rate of 20.7 percent.
Value of claims paid in life branch by years
(million USD)
300
246
250 198 214 217
200 176
150
100
50
0
2015 Q2 2016 Q2 2017 Q2 2018 Q2 2019 Q2
Techical profit and loss amounts in selected branches by quarters (USD)
ACCIDENT LAND GENERAL LAND MARINE GOODS FIRE AND SICKNESS/ LEGAL FINANCIAL AVIATION BOND CREDIT GENERAL
VEHICLES LOSSES VEHICLES ON TRANSIT NATURAL HEALTH PROTECTION LOSSES LIABILITY INSURANCE LIABILITY
LIABILITY FORCES
2015 Q2 34.708.966 51.550.935 15.748.167 (188.263.445) 10.619.063 14.067.328 8.052.388 5.645.783 2.135.403 (895.569) (511.460) (3.712.255) 14.306.400
2016 Q2 39.468.701 48.035.232 19.979.846 (74.976.185) 15.914.680 24.598.127 (5.657.467) 5.017.543 2.293.440 395.181 (199.250) (4.940.745) (10.385.668)
2017 Q2 58.303.976 57.270.151 26.254.380 19.563.182 15.997.744 35.264.929 18.385.301 11.030.751 3.102.478 (467.031) (3.838.963) 179.225 (19.773.364)
2018 Q2 77.143.785 40.089.924 29.356.960 11.513.881 25.028.577 62.933.295 36.710.488 15.475.284 6.331.058 (243.668) 1.497.357 (1.930.872) 399.501
2019 Q2 100.319.818 150.571.341 59.011.359 (128.777.095) 31.745.991 61.776.687 76.922.064 15.967.905 7.250.737 842.250 879.912 (1.576.680) (9.810.615)